I am confused, though. Why, if the screen has a rule “Close (0)> 3” does it guarantee that the screen will not match the ranking system? In the ranking system, I have the filters applied after ranking set with a min price of 3.0. My understanding was that by putting “Close(0)>3” in the screen, it would equal the ranking system.
I have spoken with Paul DeMartino from Portfolio123 and they don’t understand why my ranking system and screen are showing different results and are investigating.
[/quote]It’s complicated.
It has to do with the fact that a screen first ranks the stocks in the universe and later applies the rules, but the ranking system backtester applies the price>3 rule before ranking (which means that it treats price as if it’s part of the given universe)
When you have a single factor ranking system, you will end up with gaps; so that RankPos <= 10 may come up with less than 10 stocks.
With a multiple factor rs, the ranking order will also be affected.
Chipper, Thanks for the reply. I totally hear you on the stock universes. I use the same dollar cutoff on the custom universe and the ranker. The example I shared is different. There is no price rule when you just use ETFs. That is why I used it as an example because it is the most basic universe possible and there aren’t any limitations.
Primus, I agree on the NAs. I think Kurt pointed that out earlier. I tried to share my ranking system as a public system, but I guess I messed up. The only variable in my system is 26 week relative strength. There shouldn’t be any NAs. How can I compare ticker by tickers of the ranking system? It’s easy to do on the rolling backtest, but I don’t know how to do that on the ranking percentiles.
The ranking system should have a built in function for referencing stock ranks with respect to date. Look for “Ranks” near the top of your screen – it’s next to “Performance”.
But anyway, it sounds like Chipper6 brought up a good point about the order of operation which would also affect the results.
Thanks Primus, I found it. I appreciate the link to the article. I understand the issues with multifactor models and don’t expect them to line up. The NAs are treated as negative in my example. I am only testing the top 1% for 26 week relative strength, so the NAs should never end up in the top 1% in my test case. Once again, with the ETFs there is no order issue similar to what Chipper described for the stock screener because there isn’t a price factor.
I spot checked a few and they were all the same. So I made one real simple test. I tested one month (01/22/2017 - 02/22/2017). 3 ETFs came up and were the same for all periods (KBE, KRE, RTLA) in both the 1 week rolling backtest and the ranking. Everything checked out.
I repeated for one year and it was close. I didn’t check all 156 ETFs for this, but I did some spot checking and they matched up. I went out longer and longer and the results diverged more and more. I obviously didn’t check all these.
Well, sorry I couldn’t be of more help. If it’s true the divergence grows farther back in time, maybe that’s somewhat good since the future is what matters. But an expectancy difference in returns of the magnitude you see in the RS versus the screener is significant. Which one should you invest more trust in?
As an aside, I’ve had issues with one to several tickers causing huge swings in returns in systems. These show up as spikes in the return graph. If I notice spikes in historical returns, I will eliminate the problem tickers manually. This has caused the annualized returns of a few systems to drop significantly. But this allows me invest more confidently knowing that I am relying on a repeatable anomaly instead of dumb luck.
The RS has the ability to plot the performance of quantiles over time. Maybe there’s something easy to investigate.
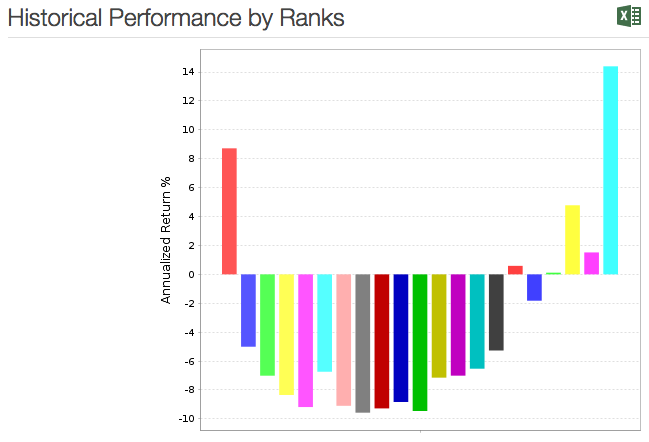
Typically when I run the ranking I break it into 100 bins to look at percent ranks. When I find one that looks promising, I try to duplicate that using the rolling backtest using the same custom universe cutting off the top say 1%. The rolling backtest almost always underperforms. The more complicated the ranking, the greater the underperformance tends to be.
As an experiment, I did this last night for a custom ETF universe using only 26 week relative strength in the ranking system. The top 1% had annualized returns of 14.9%. When I do the same using the rating>=99%, the annualized return is about 11.5%. I used a 5 year window and weekly rebalancing.
I made all of this stuff public so others can take a look. Not sure the links will work right, but below is where I show them.
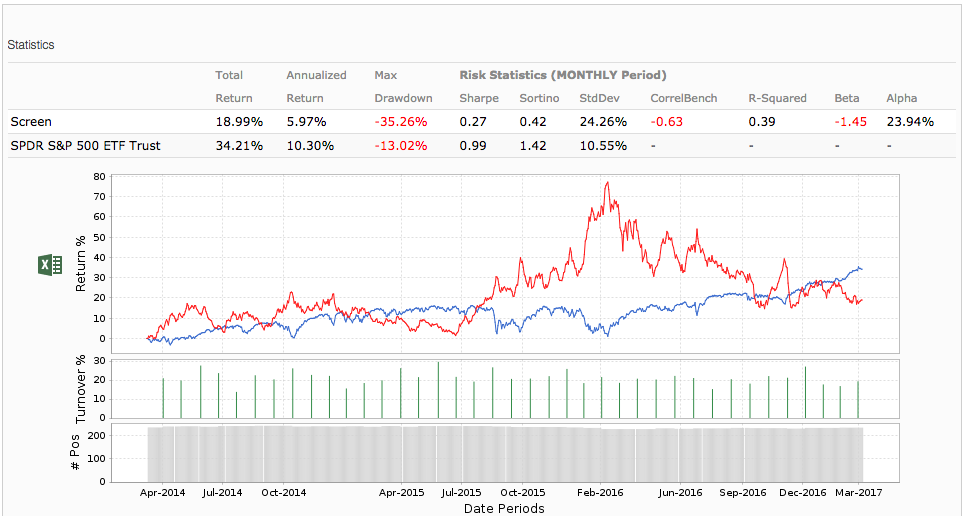
Use 02/15/2014 - 02/18/2017 (Sat to Sat)
Use the universe “Close(0)>3” in Screener and Rank Performance
Use NEXT CLOSE in the screener
In rank performance you can leave minimun price set to 3 (it won’t change anything since it’s already pre-screened by universe)
For LONG I get
Top bucket in rank performance -9.3 (rounded)
Screener annualized return -9.26
For SHORT I get
Top bucket in rank performance 10.7% (rounded)
Screener annualized return 4.02%
I need to investigate further why shorts are different.
I have tried many different rank versus screen tests today, thinking that I could help solve the puzzle. I am no closer to discovering the cause of discrepancies for short models. Here is an extreme example using the All Fundamentals - USA universe and the Basic: Momentum ranking system with a six month rebalancing for the six month period 08/26/16 to 02/26/17 for the top 0.5% (comparing top bucket of 200 in the ranking module versus Rank>=99.5 in the screener). Minimum price rule in the screen was Close(0)>=3.0 to match minimum price 3.0 in the ranking module. Checking the rank module’s stock rankings for 08/26/16 versus the screen’s 10 stocks chosen on that day does not indicate a likely discrepancy after the minimum price constraint is applied.
LONG
Rank performance 25.0
Screen annualized 20.34
SHORT
Rank performance 95.1
Screen annualized -23.23
I have much more confidence in the screen’s results. This is just one extreme example.
I just re-ran the numbers using Marco’s suggestions. I used the date range of 07/04/2009 - 02/25/2017. I did weekly just to make life easy. I then compared the results of the regular backtest, the rolling backtest and the ranking percentiles. All three numbers were different. Backtest was 15.26%, Rolling was 16.86% (0.3 annualized) and the ranking top 1% was 13.7%. I re-ran all 3 for the last two years and the results were 4.39%, 6.43%, and 4.8% respectively.
I have identified one very significant difference in calculating return per stock in a short rank performance test versus a short screen. If a stock’s return in a short screen is less than -100% (say the price triples and you have to buy it back at three times what you sold it for, causing a -200% return), the short screen shows the return calculated for the period held but the rank performance sets the return to zero annualized percent, when it should be (I think) a similar large negative return annualized.
I found this by using the screen mentioned in my earlier post, then running the short rank performance test for the same period with a custom universe that only included one ticker at a time held in the short screen for each rebalance.
For this testing, I used the period 8/16/16 to 2/16/17 and six month rebalancng to try to get the same rankings and prices at the beginning and the rebalance.
One other difference I noted has a cause someone familiar with how the rank performance rebalances would have to comment on. The screen rebalanced on 2/13/17 (a Monday), 26 weeks minus a day from the start date (a Tuesday), using rank data from 2/11/17 (previous Saturday). It then rebought the sold stocks on 2/16/17, the end of the test period. The short screen calculated varying returns for the short holdings during that period. The rank performance test from 8/16/16 to 2/16/17 with 6 month rebalancing, when limited to one stock at a time shorted on 2/13/17, showed zero returns for 8 of the 9 stocks and -100% for one. Not sure what to make of that.
Still investigating. I don’t think there’s a major problem. There appear to be differences in how the last period is handled, but overall I’m matching values. I have a way to generate a log of a rank performance run (which we will expose soon) and I compare it to the log generated by screener backtest.
I’m trying to make the rank performance look somewhat decent then I’ll post it.
I think I found the issue. The Rank Performance had a “safety check” that threw out returns greater than 1000% and less than -100%. That’s probably ok for longs, but for shorts you can certainly lose more than you have. When we added shorting we did not remove the safety check (we also typically test with smaller universes, like sp500, and it’s much harder to lose 100% in one period so the problem went unnoticed).
A fix will be released today. For next week we’ll also release the ability to generate a log for rank perf runs (like the screener backtest) which is very handy to check the setup and what it’s doing.