There’s a lot of interesting ideas in this thread, and Jim has an excellent post on Oct 13 about Spearman rank correlation which resonates a lot with how I think about ranking systems.
As an exercise, look at the current holdings for one of your ranking systems. Plot the overall rank of each stock as well as the distribution of rankings for each factor within the system, again for your current holdings only. Here’s what one of mine looks like.
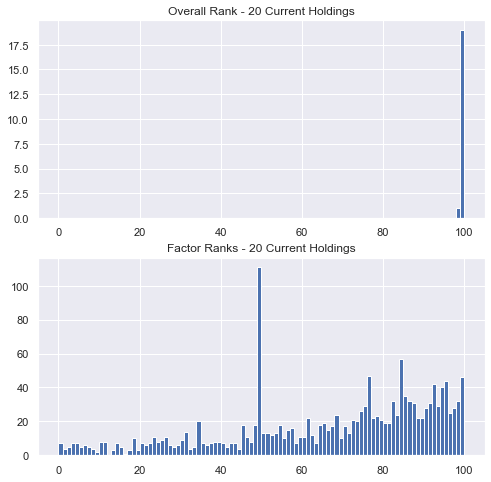
For most systems, you’re likely trading from the tails of the overall rank distributions but from the bellies of the factor rank distributions. Of course this can vary – if you carry more positions, have longer holding periods, etc., but in general, this leads me to evaluate ranking system performance differently from factor performance.
For ranking system performance, looking at the performance of the top bin, or the top few bins, is most helpful for me. But when evaluating a factor, I usually want to know if a higher factor rank will tilt me towards higher overall return, and that’s exactly what the Spearman rank correlation measures: whether there is a monotonically increasing relationship between factor rank and return rank. Of course, other metrics can be useful for factors too, looking at top minus bottom quantile performance for example, but as the histogram above shows, we’re not usually holding the top (or bottom) stocks for individual factor ranks.
Personally, I’d find it very useful if the rank correlation were included in the Rank Performance and Ranking System Optimizer outputs.