I am in the process of investigating a large performance difference between a live book of long/short strategies and a simulated book of the same strategies over the same date range.
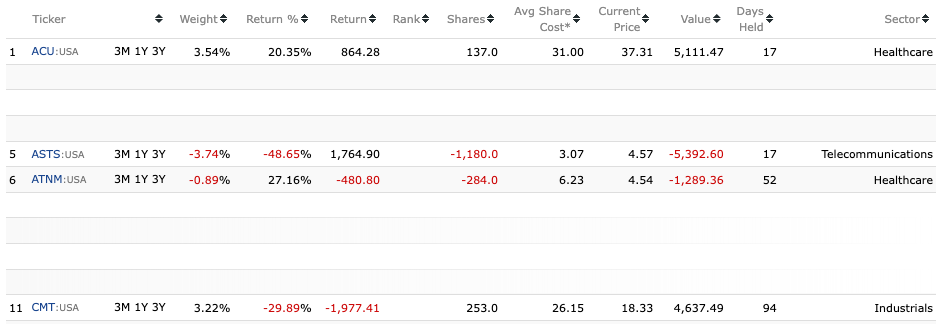
One thing that I’m trying to wrap my head around in the live book is the accounting for shorts. In this example of current holdings from the live book, I’ve highlighted four holdings to show each combination of a long/short and winner/loser.
The winning long trade (ACU) and the losing short trade (ASTS) both show a positive return. Similarly, the winning short trade (ATNM) and the losing long trade (CMT) but show a negative return.
I’m not at the level of membership to test it out, but it looks like you are entering the short positions as a negative share count. Since you have marked them as a short the position weight is already recognizing it is negative. So a negative multiplied by a negative is a positive. Try changing the share count to be positive.
The negative share count is a non-issue. For one, it’s not something the user has control over, and it’s a standard way, within p123 and beyond, to represent short orders or positions.
Still, I don’t see how it’s feasible for a winning long trade and a losing short trade to have the same signed notional return in a live book.
I would appreciate if someone from p123 could look at this, as I have growing concerns there’s a bug somewhere, but with a closed source system like this, I’m somewhat hamstrung in my ability to debug.
Over 01/10/2023 - 11/17/2023, my live book shows a 45.3% return while the simulated book over the same period shows a 21.3% return. My concern is that the live book implementation is completely different the simulated book implementation. The simulated book is a composite of underlying strategies while the live book is a book of the underlying positions yielded from the same strategies, so the code path for handling short sales within a book is not exercised in backtests. I also don’t know how many users are using shorts within a live book, so again I’m not sure how well-tread this path is.
p123, I would greatly appreciate some eyes as soon as possible on short-related code, as I am observing several issues across the platform that may be affecting trading.
The aforementioned large divergence between live and simulated books containing short strategies.
Live books showing same signed returns for winning longs and losing shorts, etc.
The performance chart for an account strategy following a live long/short book (/app/investment/details?id=&t=performance) is not correct – it’s showing performance far lower than what it actually is. Likewise, there is a subchart labeled “Exposure” that doesn’t look like gross exposure or net exposure. It looks more like net liquidation value.
When I rebalance my account strategy following the live long/short book, I don’t think I’ve ever recalled seeing a “rebalance” labeled trade that increases the size of a single position. It’s always a cover rebalance or sell rebalance that is decreasing exposure. This doesn’t make sense.
Potentially related to #4, the gross exposure of my account strategy following the long/short book repeatedly decreases over time and I have to top it up every several weeks.
Happy to be provide any details offline to help debug this.
We can’t really give an answer to this without knowing which strategies to look at. Simulated books may not be giving the same result since they rebalance entire strategies as assets and compute a weighted return of those.
The return amount is wrong on the holdings page. It’s only a display issue.
through 5. The Manage side of the operation does not handle short positions correctly. We currently have no plans to fix this as it’s labor intensive and there have been few complaints. On the other hand, rebalancing short positions directly in the book or in the individual live strategies (in Research) that are the book’s components should work. If I’m wrong and there’s a specific example where a live strategy or book is misbehaving, please let us know and provide the specifics.
I apologize for the delay in getting back to you and for the fact that some things are broken when it comes to shorts.
Oof. That is an incredibly disappointing stance, and one that I hope you guys will reconsider. I would have liked to believe that bugs affecting users’ real dollars that they’re putting at stake would be taken seriously.
Can you at least elaborate on the scope of the bugs in play? I’m trying to assess how urgently I need to move my trading off of portfolio123.
This live book shows a return of 49.85% while the simulated book over the same exact period returns 24.31%. The simulated book does rebalance its strategy mix for the first time on 10/30/2023, but even up through the prior day, the live book is at 38.77% while the simulated book is only at 18.19%.
We think the large differences between the live book and the simulated book is in part due to the fact that the asset tolerance in the simulated book is 10%, which is so high that no rebalancing is taking place, while the minimum rebalance transaction in the live book is only $5,000 out of a starting sum of $100,000, or 5%, which is allowing plenty of rebalancing, particularly as the sum under management grows.
As far as the scope of the bugs in Manage when it comes to shorting, we know that the performance figures are way off, but we don’t have any evidence that it’s affecting rebalances based on live strategies/books. When we tried rebalancing your live long/short book in Manage, we did see trades that increased position size. You might want to decrease the minimum rebalance transaction in your live book, which may be decreasing the gross exposure of your account strategy, though I could be wrong about that.
As far as I know, the only bug in Manage is its inability to fully accommodate short positions.
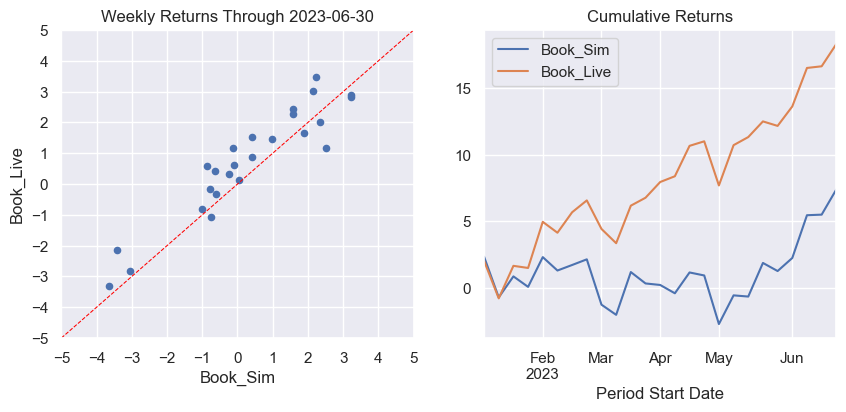
The live book has 1,115 trades, but only 4 rebalance trades, on 07/03/23, 08/07/23, 10/23/23, and 10/30/23. If rebalancing were the cause of the divergence, I’d at least expect to see similar performance up though 06/30/23, the week prior to the first rebalancing trade. That’s not the case.
I see two very different outcomes when I click rebalance on a managed strategy following a live book.
If I click rebalance on a date where the underlying live book did not trade (like you did today), I see proposed rebalance trades of all four cases: buy/long, buy/cover, sell/long, and sell/short. I even see an option to add cash to the strategy to minimize trades that reduce positions.
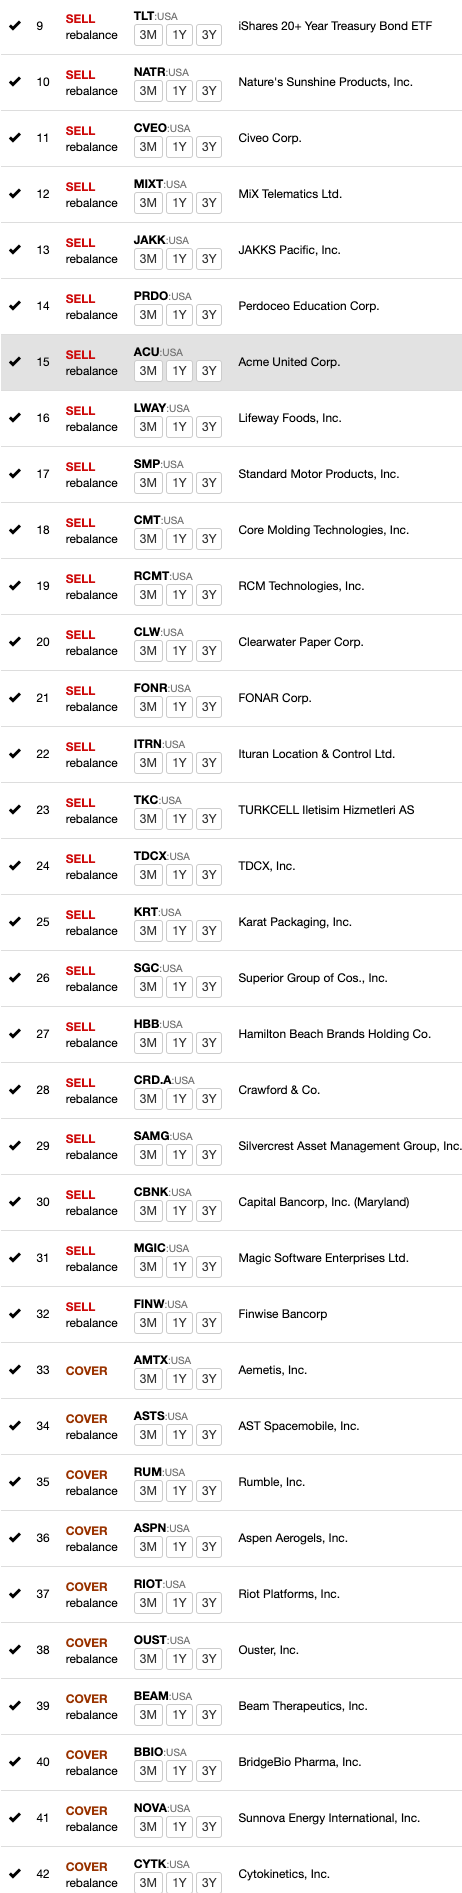
On the other hand, if I click rebalance on a managed strategy on a date where the underlying live book did trade, which is typically Monday mornings, I see regular long and short trades that initiate and close positions. But I can only recall seeing proposed rebalance trades for sell/longs and buy/covers, i.e. trades that reduce exposure. And as a reminder, rebalancing trades in the underlying live book are relatively rare (4 out of 1,1115). But every week, the rebalance on the managed strategy is trying to generate rebalance trades that shrink exposure. This partial list was from this Monday alone.
Aaron and I spent a couple of hours trying to figure this out and we actually did figure it out this time.
Your live book has a minimum rebalance transaction of $5,000. This refers to all transactions, not only rebalancing between assets, but also rebalancing between holdings. So a huge amount of the activity in the individual strategies was being ignored by the live book. The simulation accurately reflects the performance of the individual strategies. The live book ignores the majority of transactions in some of those strategies.
If you want the live book to replicate the underlying strategies, please set the minimum rebalance to zero. You should also set the starting capital to be equal to the starting capital in the individual strategies so as not to have high-priced shares create additional tracking error; slippage and commission should also be set to zero.
Yuval and Aaron, thank you for continuing to dig, I appreciate it.
Ok, so this is interesting. I initially didn’t think I would have many rebalance transactions at the holding level or the book asset level (i.e. strategy level) for two reasons: a) there are no rebalances of strategy assets in the simulated book for the first six months (January to June) and b) my individual strategies do not use any formula weights or sell rules for rebalancing holdings.
But I did a full diff of holding level transactions between the 5 constituent strategies and the live book, and there are 292 transactions in the 5 live strategies from 2023-01-10 through 2023-12-01 that are not present in the live book. It looks like they fall into three categories:
22 Increase/Decrease hedge transactions for TLT
52 Decrease position trades for long holdings in the TLT hedged strategy
218 other Buy/Sell/Short/Cover transactions across the 5 strategies
Presumably the 74 hedging related transactions were filtered by the $5000 rebalance transaction threshold.
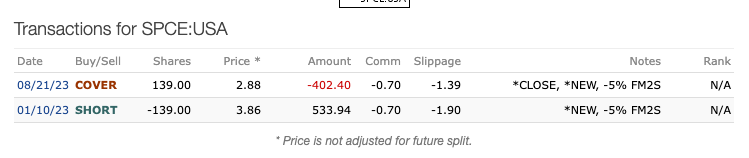
Now the other 218 trades are really insightful. At the strategy level, they are not rebalancing trades – they’re all initiating or closing positions. But because my book consists of 2 long and 3 short strategies, I often have overlapping holdings across the long strategies or the short strategies. The first of the 218 omissions occurred on 2023-01-17 when the live book did not yield a short SPCE trade which was issued by my short v1 live strategy. As it turns out the live book was already short SPCE from the week prior due to the short v2 strategy:
So at the book level, this would have been a rebalancing trade, even though it was a new position trade at the strategy level. Fascinating.
Presumably, these trades were falling under the minimum rebalance transaction threshold due to their book-level classification as rebalances?
There’s all sorts of combinations of these omitted trades, including trades that reduce positions, e.g. the v2 and v3 short strategies both short CVNA on 2023-02-06. The v3 strategy closes out its position a week later, but again the “rebalance” is omitted at the book level, etc.
I created three new live books to test this out:
A live book with the same $100,000 initial capital and with a zero minimum rebalance transaction
A live book upsized with more capital and with a zero minimum rebalance transaction
A live book upsized with more capital, with a zero minimum rebalance transaction, and with zero commissions
Having a way to backtest books at the holding level would be invaluable here. As it stands, I have to hurry up and wait and see what the trading from these live books converges to over time.
But why should slippage and commissions be set to zero here? Are they being doubly applied at the strategy and book level if set to nonzero values at the book level?
If that is true re: commissions, I would expect the live book to be systemically disadvantaged against the simulated book. Likewise, the omission of what should be positive expectancy “rebalancing” trades at the live book would also seem to disadvantage live books. Instead, the live book is soundly outperforming the simulated book on 93% of market days (even though they only trade on 20% of them!?), with a sharpe ratio of the daily pnl difference of 1.64 and a t-stat of 12.1! A very, very significant daily difference.
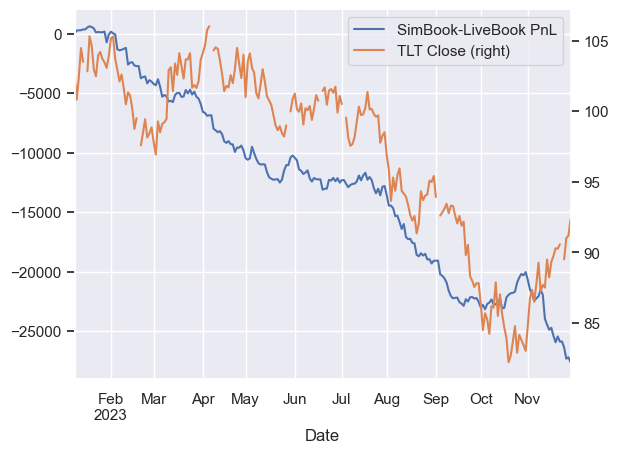
If I overlay the daily pnl difference (of the simulated book minus the live one) with daily TLT close prices, we can see some correlation, about 85%:
So some of this pnl difference could be attributed to the omission of the live book buying more TLT to hedge due to the minimum rebalance threshold while TLT was plummeting, but clearly something else is going on, and the commission issue and other 218 missing rebalance trades should be hurting the live book performance.
I feel like we’ve learned a lot here, though there appear to be more layers to this onion.
To my mind, omitting a huge number of small trades is more likely to help a strategy than to hurt it. You make 292 additional transactions over a period of 10 months, each of them costing you about 0.5% in commissions and fees, and that’s going to really add up. And then there’s the TLT exposure. All of that seems like it would overwhelm the additional fees for the larger transactions in the live book.
Can you explain how slippage and commissions are accounted for in live books if they’re zero at the book level but nonzero at the sub-strategy level? I examined one of the new live books I just created with zero commissions and slippage, but I don’t see how those costs percolate through from the strategy? Instead I just see transactions filled at the exact mark price with no slippage or fee adjustments.
If I were double counting slippage and commissions in my original live book, I’d expect the live book to perform far worse than the sim book, but remember it’s the opposite case.
I stumbled on one other possible error with the live book implementation when looking at these numbers: carry cost. In the strategies, I see margin expenses accounted for as monthly Cash “Carry Cost” transactions, but I do not see these at all in the live book.
Are weighted margin costs from the strategies accounted for in live books?
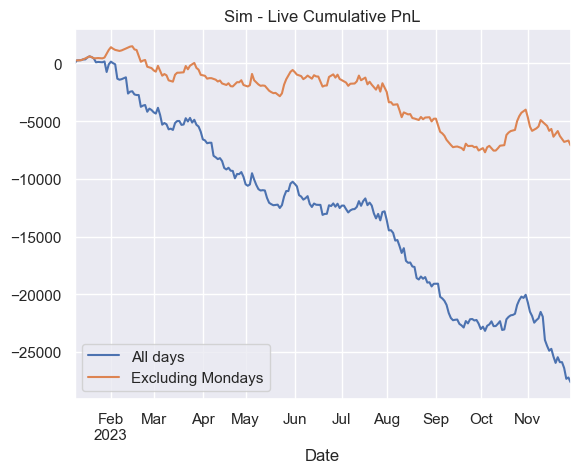
There may be some truth to your intuition. I examined the daily series of the average change in sim minus live book equity by day of the week and it is far worse on Mondays, i.e. trade days.
I may have been somewhat incorrect in my previous post. Here’s how things work. The live book takes the weights from the live strategies and ignores the fees and other cash changes, including slippage costs and carry fees. Slippage costs and margin in the live strategies affect the weights of the individual positions. Those weights become the basis for the individual transactions that the live book carries out, subject to any rules that the live book applies to those individual transactions (e.g. don’t make any position changes under $5,000). Any slippage or other costs in the live book are then applied to the individual transactions. This is very different from the way a simulated book works. The simulated book simply combines the live strategies after the fact. I hope this clarifies things; if not, please let me know.
Let me see if I can summarize things. Please correct me if anything is inaccurate.
Live Books
In live books, slippage/fees are not passed through to the book, but book holding weights are calculated from the post-slippage/fee weights of individual holdings in the strategies. If you have the same fixed percentage slippage across your strategies, then this should not skew the holding weights in the parent live book.
If you want to account for slippage and fees in a live book, they need to be set to non-zero values in the live book.
Margin costs are not accounted for in live books, which means any live book with a short strategy is undercounting costs; same goes for a live book with a margined long strategy (mine happens to have both).
There aren’t known trading errors off live books with margin, just costing errors.
Due to #3, a simulated book over the same period as a live book will give a more accurate picture of the trading performance of a book of strategies utilizing margin.
The minimum rebalance transaction threshold of a live book applies to any transactions that size up or down a book level holding. Transactions that initiate or fully close a book level holding are not subject to the threshold, but a strategy transaction that initiates or closes a strategy level holding could still be classified as a book-level rebalancing transaction subject to the threshold if other strategies are holding the same symbol on the same side.
Setting the initial capital of a live book to too low of an amount relative to the number of positions could cause some tracking error.
Live books should be set to rebalance as frequently as their fastest rebalancing asset. This is not a takeaway from this debugging exercise, but I have been bitten by it in the past, and this “Portfolio and book performance” thread does a good job of explaining the issue. It would be helpful for p123 to warn when running a live book with a mismatched rebalancing period to its underlying strategies.
Known Shorting Issues
Live books do not account for short sale borrow costs (see #3 above).
Lack of broker borrow cost data will make it hard to accurately model short strategy performance and potentially profitably trade off short ranking systems.
On /holdings.jsp, live books will show the incorrect sign in “Return” column for short positions, but this is purely cosmetic.
Under the Manage accounts pages, there are a few places where the term “Value” is used interchangeably for net liquidation value and net exposure, and where the term “Exposure” is used interchangeably for gross exposure and net exposure. This doesn’t cause any shorting issues but can be confusing for accounts with short positions.
a. On /app/account/details?t=investments, the lower strategy table has a column labeled “Value” which looks really to be the net exposure (long - short) of each strategy.
b. On /app/investment/details&t=summary, “Market Value” of the strategy is actually the net exposure.
c. On/app/investment/details&t=performance, the “Exposure” plot shows the net exposure.
d. If you then click Add/Reduce Exposure for a strategy, the “Strategy Exposure” looks like it refers to the gross exposure (long + short).
Anything I miss?
Did you guys make any fixes to /app/investment/details?t=performance in the last couple of weeks? It seems to be showing the correct performance for live books with shorts now.
If you add money to a port the Book will not be right. I used books for a short while and probably will again. It is certainly a useful tool. But I thought I was a trading genius for a short while until I realized that the money I added to one of my ports looked like an investing gain. Sims are okay as cash in not added to sims.
I’m checking into this, but I think in the live books section you’re correct. I’ll update you if I’m wrong.
I would advise not using Manage for any strategies or accounts with short positions. It simply isn’t configured to handle them correctly. So I have my doubts about all of #4 in “known shorting issues.” Again, I’m checking into this and will update soon if I’m wrong.
I checked. You seem to be correct on all counts. The issue with shorting in Manage has to do with strategy performance, which is not calculated accurately. We have not run into other problems with short positions, but this particular problem makes us worry that other problems might exist. We have not made any fixes in the last few weeks. Account performance is calculated differently from strategy performance in Manage, and does not seem to suffer from the same problem.
Thanks for all your help in debugging this. I feel pretty comfortable on our handle of the live book vs sim book differences at this point. I’m going to spend some time digging into the investment account performance vs the simulated book to get a sense of where the shortfall there is coming from. It’s not as egregious as the live book vs sim book outperformance, and with actual trading, there’s already several known contributing factors in my case out of the gate. My realized borrow costs for shorting are higher than as set in the short strategy and simulated book, in the 7-9% range, but they vary across both asset and time. I’m also manually filtering some short trades where the annualized broker borrow costs are in the 80%, 100%, or even 200% range. These actually could be net profitable trades, but without the historical borrow cost data to test that hypothesis, it seems more prudent to assume they are negative expected value trades at the moment.
No, you’re right, I checked again and the strategy performance chart is still wrong. Not sure what I was looking at earlier.