[quote]
Why wouldn’t you optimize an ETF model up until 2015 then use 2015 till now to get out-of-sample results. That way you would not have to wait several years to know if the model is good.
[/quote] Valid point, Jim. I did not do that this time, but should have. I prefer to leave some recent time out of the modeling process until the end as a better approach than attempting to optimize factors, weights, and such, but sometimes I just don’t.
This is what I found about Ray Dalio’s Pure Alpha Fund:
"Bridgewater’s Pure Alpha strategy has generated an annualized return of 12 percent since its inception in December 1991. But it posted a long streak of mediocre returns from 2012 through 2017, producing gains in the low-single-digits each year. "
RenTech RIEF in recent years:
“In 2013 it delivered 17.64%, in 2014 it brought back 14.53%, followed by 17.37% in 2015, 21.46% in 2016, 15.22% in 2017, and 8.5% in 2018.”
I do not think the annualized returns of 12% and 11.5% (rounding error) for the Alpha Fund and RenTech RIEF can be compared due to different start dates. Perhaps they could be compared to each other if the excess returns were given (I do not have that data).
Recently anyway, RetTech wins in a fair comparison of long term investing strategies. At worst (for RenTech) one cannot prove one strategy is better than the other.
Clearly, RenTech has a viable long term quantitative investing strategy for its RIEF Fund.
It is possible that Ray Dalio is having some of the same problems we are when trying to compete with RT;-)
-Jim
Some stuff from my trading coach:
I think the first thing you need to do as a trader / Investor is to analyse your competetive advantage.
- Emotional Stability, Faith, GRIT
- No pricipal agent problem bc. you trade your own money
- Not to have to track the index
- relative small account size (size and liquidity premium is big!)
- P123, with a great cost/value structure, Great Community
- longer term horizon (not investing, not trading, something in between, a nice niche!)
- Beeing able to trade with minimal price impact (scaling in and out of position, Limit and GTC Orders, o.k. Broker)
- Knowleged about emotions of market participants and how to hack them with stable factors
- factor diversification
What I do not have:
-
Besides PIT Data from P123 (which is a big comp. advantage!) I do not have (yet) Alternative Data (the biggest driver from R., their AI works super, bc. they have
tons of Alternative Data available before the others have it, that is 80% of their edge) -
Intersting way to fund my leverage (And I am glad, bc. big leverage is a high prob. death in the future, no matter how you structure
your trades! If your shorts go up and your longs go down and your are leveraged you are done, I believe that even R. underestimates
that kind of risk, a lot can happen in 100 Years.)
Its o.k. to look what R. or for example prop Trading firms do and get inspired. But at the end of the day you
got to trade what is in front of you (your existing completetive advantage!)
I know the grass is always greener on the other side, but from my experience this is dangerous thinking.
“Just that one improvement of my trading system and I will be fine. And then the next, and the next, and the next.”
You will never find a system that is a straight line with a Sharpe of >4 and no DDs.
That will probably not be reached by a lot of us. Deal with that!
So what now?
Work on your mental state and be able to trade what is in front of you! I would be happy to cost average into the SPY and I am thrilled
on what modells I created on P123. Value that!
Try to get rich slow, not fast and teach yourself to be able to get through DDs and be thankfull on what you have and
economize as much as possible and invest it in your port.
That is 80% of the game (20% is the trading system!!!).
An investor with that mindset with a not so good strat will outperform somebody with a much
better strat. Its not what you know in investing, trading, its how you behave consistently over 25 Years that makes you successfull!
I know Prob traders that made > 100%, 500k a year. They blowed the money and did not reinvest it.
Their edge went away and they where out of business (I can related, I did something similar from 1996 - 2003).
If you are north 10-20% ann. all you need is time! Be thankfull and have faith, its important!
In the meantime you can work on your edge, but know your competetive advantages and sharpen them (the mental side as much
as the system).
Best Regards
Andreas
Me, if I were trading the black-box strategies (equal weight) from some of the Designers I would need more than a coach. Maybe some medication would help. But a coach would not cut it.
Maybe a therapist to help me understand why I would do such a thing in the first place would be the thing.
Everyone is all for screening stocks then understanding them fundamentally, Fine. But then P123 has a business model that advocates automated black-box strategies that have always performed below their benchmark, on average.
Maybe someone should just admit me—the world (or me) has gone mad. But until they shock me or give me a lobotomy I cannot see why we would not want to diversify this model.
We are all for Fundamental Analysis until it is time to invest in a black-box created by a retired Engineer or IT guy in a basement somewhere whom we have never met.
I do like P123 a lot—especially since I am that guy in the basement. That guy with no formal training in any pertinent field.
P123 is a great manually optimized quantitative investing tool. Committed to making not a single advancement in the quantitative strategies market for some reason.
-Jim
One has to agree with Jim.
I made the exercise to check the 5-year returns of the Designer Models.
There are 75 DMs with inception 5 years ago or earlier.
The average total return over 5 years of the 75 models= 23.4%.
and the excess 5-year return over SPY= -43.8%
There are only 6 models which outperformed SPY over 5 years.
For the 6 models the average excess 5-year return over SPY= 25.8%
That is not great. We have to do better than that.
Perhaps good market timing is the answer.
Excel file is attached.
P123_R2G_List 12-9-2019.xlsx (58.7 KB)
Hi Georg,
I am curious, why do you think we (the collective “we”) can develop timing models that add excess returns if “we” can’t do it with non-timing Designer Models? I thought it was widely accepted that timing the market is incredibly difficult to do.
Do you have a method or a model that has provided excess returns over a significant time frame, out-of-sample?
Thanks.
Doug
x
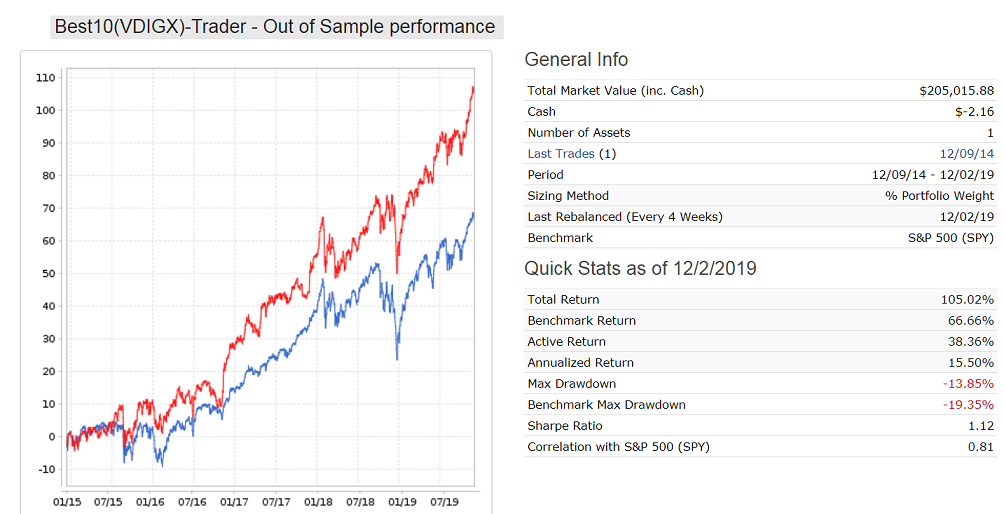
The best I can offer with no market timing is the Best10(VDIGX)-Trader. It selects 10 stocks from Vanguard mutual fund VDIGX according to a fairly simple ranking system. This has been live since October 2014 reported on our website iMarketSignals. The universe is updated every 3 months with the holdings of VDIGX.
As one can see it its excess 5-yr return over SPY = 38%, with lower max D/D. It also had higher return than SPY each calendar year. There has been discussions of this in the forum before. It’s not a secret - anybody can do it.
Thanks Georg,
I don’t think my question was very clear, sorry. I was interested in a market-timing model that has provided excess returns over a significant time frame, out-of-sample. I would love to subscribe to that, or learn to build my own. Thanks.
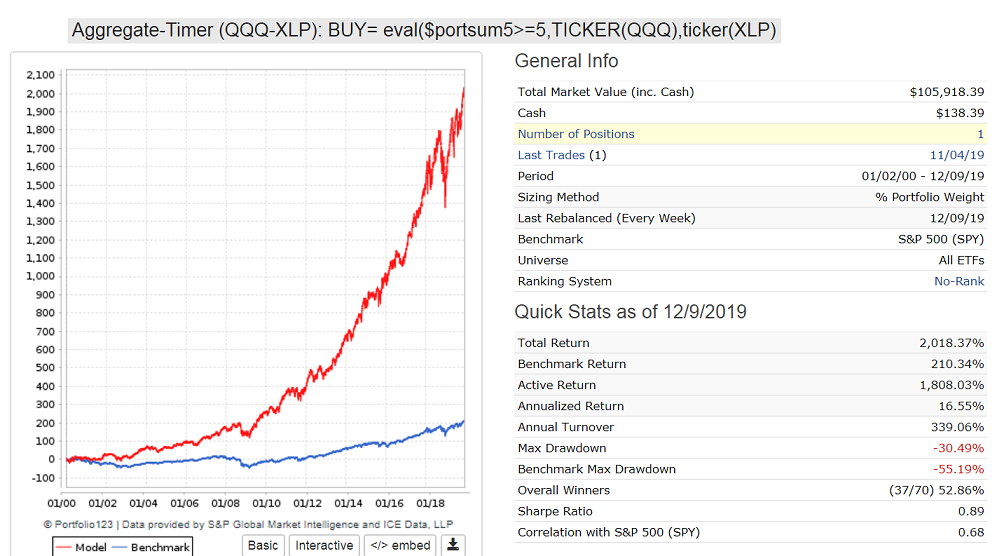
Jim, QQQ-XLP works better.
Here is the backtest with my market timer formula $portsum.
I will explain the market timing strategy later.
Georg,
Thank you for the spreadsheet. And it is good to read that you agree with the premise of my post. I am relieved to find that I am not the only one who may be in need of shock therapy;-)
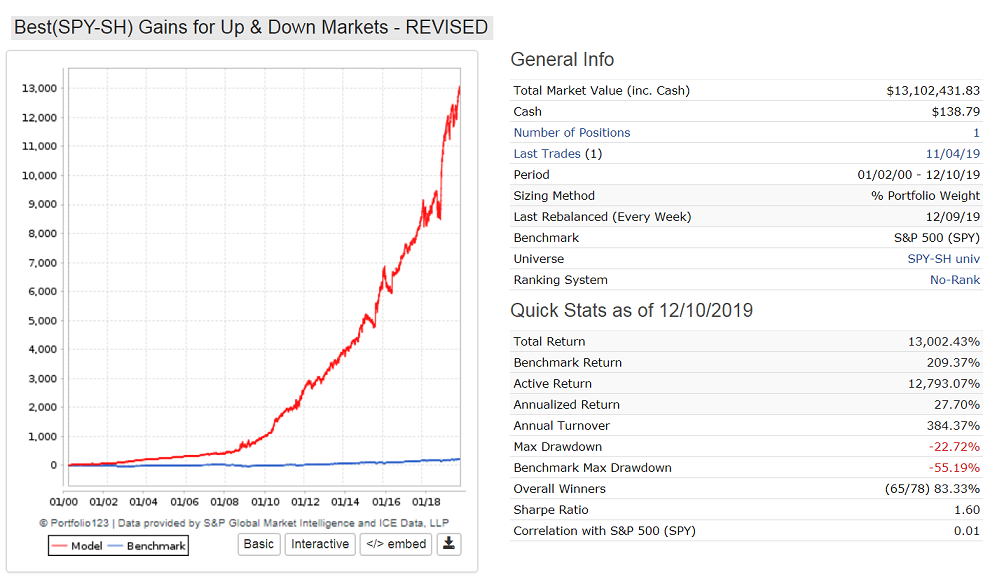
There seems to be an error with regard to the excess returns of you Best(SPY-SH) Gains for Up & Down Markets model, however.
You report excess returns of 39.38 see image.
I show the equity curve for this model illustrating this can be correct (second image).
To avoid accidentally making a similar error I just looked at the average 2 year excess returns of all of your models that had more than 2 years of excess returns for you. This is downloaded by P123 in a spreadsheet and does not require any calculation on my part (other than the spreadsheet finding the average of the column).
This was -6.24
People need to do this for all of the Designers that have an opinions in the Forum to see if what they post corresponds to their objective results. Sometimes it will (if you forget about survivorship bias).
Honestly, a full financial interest disclosure should have the Designer’s results as a part of every Designer’s post (without survivorship bias).
When will we stop chasing cherry-picked examples?
-Jim
Jim,
I picked off the 5-yr returns from the performance graph.
Here is what the return looks like today, with Monday’s Dec-9 end date.
I am not saying that this return is particularly good, but at least it is better than buy&hold SPY. I will revise this model in line with my most advanced market timing strategy for better returns in the future.

Geog,
Thank you for the clarification.
And clearly your models do better than most.
I still stress the importance of avoiding cherry-picked examples to people.
More broadly, you have confirmed that the math regarding the performance of all of the Designer models is correct. Thank you for alleviating that concern!!! Although I kind of wish we were both wrong on that point.
Very much appreciated. I do not like getting my facts wrong (which I did).
-Jim
Thanks Georg for taking the time to do the study.
These are pretty shocking numbers. especially given the high turnover of many models. In search of outperformance, are we model builders guilty of over complicating things and building in sample optimized models/ ranking systems?
Jim, thank you for raising this topic in the first place.
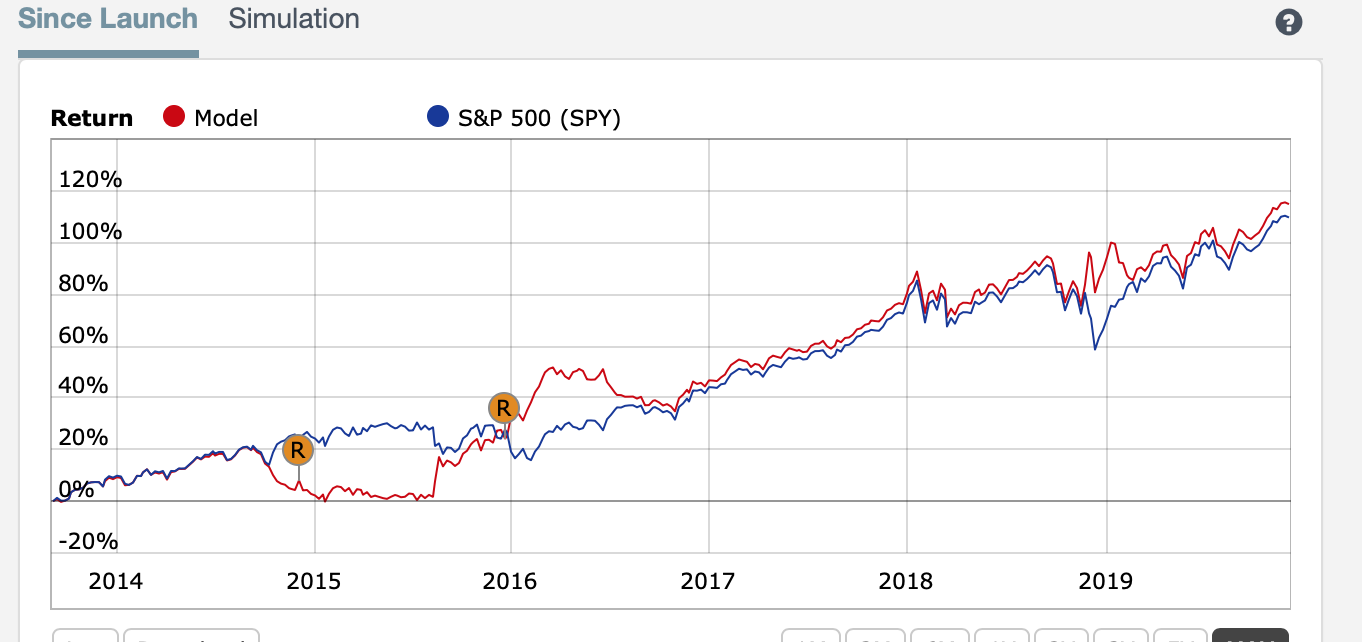
I will now revise the Designer Model (SPY-SH) to include my most recent market timing rules. It should now perform better.
See attached simulated performance curve and stats.
Noteworthy is the correlation with SPY = 0.01.
So the t-score on this is 11. This is for a single-sample t-test.
p-value? I cannot easily find any programs that will print out anything that small even using exponential notation. I may look later and amend this if I do.
Chances that Designer models are inferior to their benchmark over the most recent 5 year period? About as certain as you can be of anything in this life. Even with any survivorship bias that may exist–which would make it worse still.
-Jim
I think designers want to show huge backtest returns. That is not a good strategy because those returns are not achievable going forward.
Designers should aim for a 20% annualized return, then everybody will be happy with 15% in real live. Nobody would mind getting a steady 15% on their money.
Georg,
I could not agree more!!!
Honestly, I am wondering if Ray Dalio’s 12% might be a more realistic goal for me personally when the dust settles. Anyway, whatever number I finally arrive at the number will be changed forever after this.
-Jim
Interesting discussion.
Goes right into the critical issue: Do we have any reasonable conviction or even facts, to think that forward returns are in any way similar to the backtested ones?
Do we have any metric(s) or parameters which will show us overoptimization? That should accompany any model.
As Georg is rightfully saying:
“I think designers want to show huge backtest returns. That is not a good strategy because those returns are not achievable going forward.”
Exactly.
Werner
The answer to both questions is no.
We can assume that things that have worked in the past have a higher probability of working in the future than things that have totally failed in the past. In other words, stocks with very high accruals and very high price-to-sales ratios are likely going to keep underperforming stocks with low accruals and low price-to-sales ratios.
However, we can also assume that there will always be a fair amount of mean reversion going on as well. And we can assume that many widely used factors and/or approaches may end up being arbitraged away. And there can be massive “regime changes,” black swan events, that will put everything out of joint.
As to how all those things will cancel each other out, we have no idea.
As far as I have been able to tell, there are no metrics that measure over-optimization with any degree of certainty. But there are questions that should be asked of any designer.
-
How does your system perform if you increase the number of holdings by four? by ten?
-
Have you tested your system on out-of-sample periods or universes, or on partial universes and/or partial time periods? And are the results consistent?
-
Have you built your system by constantly tweaking minor details to get a better and better backtested performance? If so, it may be best to stop doing that–it may be detrimental to out-of-sample performance.
I have built six designer models. Three of them have significantly outperformed their benchmarks. One of them I removed because I had lost confidence in it. The other two are underperforming their benchmarks, but only barely. I have been guilty of over-optimizing as well–I built all six models by constantly tweaking minor details in order to get optimal backtested performance. I don’t know whether that proves anything. The oldest of these models have been live since early 2017–over two years now. I also have been using optimized models for live trading since late 2015, during which time I have maintained a CAGR of 30%. My live trading has underperformed in the past year or so, but it has still been profitable (13% YTD), and because I aim for low beta, I expect to underperform when the market is going gangbusters. So in my PERSONAL experience, over-optimizing has not been harmful. I still think, however, that it’s not a good thing to do.