Hi, @FrancesWalsh, sir (ma;am?) ! Welcome to the forum! You are going to meet some really smart investing/trading gurus/geniuses here on this forum. You are also going to meet wannabes like me, for whom the Dunning Kruger effect is evident.
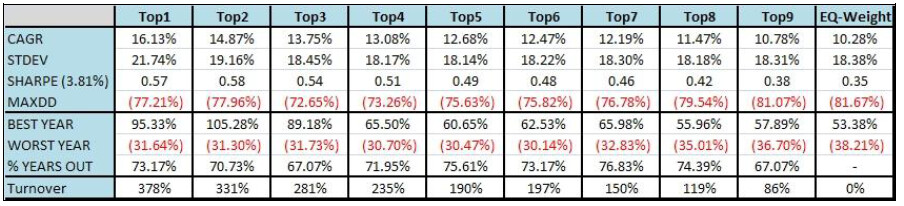
Thank you for your comments. It could be that I have misinterpreted the paper (SSRN 1585517, found here), or that the source of data gives different results than the data available to me in Portfolio 123. Faber used the data contained in the French Fama CRSP Library (see here). But the ideas in the paper were to use the 10 sectors in the US economy (now 11*) and rank each sector by relative strength (momentum) using the 1 month, 3 month, 6 month, 9 month, 12 month, and combination look back periods and see how the different sector rotations performed using the top 1, 2, 3, … 9, as well as equal weight. The performance of each portfolio over the period 1928-2009 is shown in exhibit 4.6, p. 9:
Mr. Faber then showed in Exhibit 6, p. 11, how using the top 1, 2, or 3 sectors performed versus B&H for the different decades:
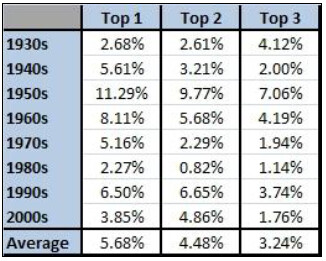
As is seen in the table, the strategy outperformed every decade, more in some decades and less in others. Mr. Faber then goes on to describe how the returns can be improved by being fully invested when the market is going up (as indicated by the 10-month SMA of the S&P 500) and being in cash when the market is going down. The returns of the portfolios improved and the drawdowns lessened, as shown in exhibit 7, p. 12:
I then attempted to replicate the results. I was hoping that I could reproduce the results of the decade of the 2000s as reported in exhibit 6, and also was interested in seeing if there was a drop-off in performance of the strategy after the paper was published. I then ran the test for the period of 2002 Jan 01 to 2022 Jul 02. I used a 4 week rebalance period and the 200 day SMA of the S&P 500, since using monthly data is difficult in P123, as well as an ETF universe of 11 sector ETFs.
Imagine my surprise when I could not reproduce the results of his study for 2002-2009, with my version underperforming the S&P 500. So that is why I posted this thread, hoping to find out if (1) my test was invalid or otherwise incorrectly designed, (2) the use of a 4 week rebalancing period is sufficiently different from a monthly period that the comparison isn’t valid, (3) my ranking process of combining the 6 month (130 day), 9 month (195 day), and 12 month (251 day) relative strengths into a single rank was not valid.
So, Mr @FrancesWalsh, sir, I appreciate your comments and still ponder if my test was invalid or if the performance as discussed in Meb Faber’s paper cannot be duplicated in P123 even with a perfectly valid ranking ad trading system.
Cary
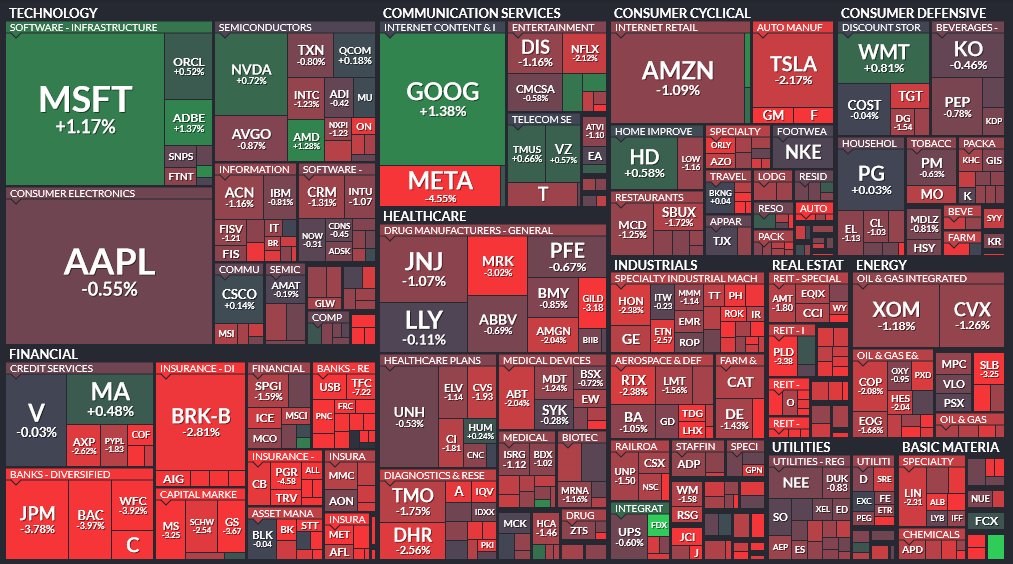
(^) now 11 sectors as shown in finviz.com’s heat map from Friday, 2023 Mar 17 close: