I want to subtract universe gains from my ranking system gains to get alpha, but the way I am calculating universe gains results in a negative annualized return over the last 10 years.
I am running my own optimization and simulation using api data and I cap the next week returns for my universe (I winsorize the top 1%), such that when I optimize I don’t just optimize to the outliers. However, when I checked to see what the universe returns were such that I can optimize alpha and I saw that over the last 10 years the total universe return was negative which really surprised me.
I tested something similar in the simulator by removing the top 1% by using FRank(“Close(-6)/Close(-1)-1”) < 99. This is more severe than capping especially since the removal is calculated weekly instead of over the whole 10 years, but I don’t know how to test that on the website. Also I see a negative return by removing the top 1% until I look at Close(-21) which is about 1 month.
Am I missing something, or is this behavior common? I know it is sometimes in the S&P500 most of the gains are driven by a few stocks and potentially on a few days, but I did not expect the same in the Russel 2000 universe.
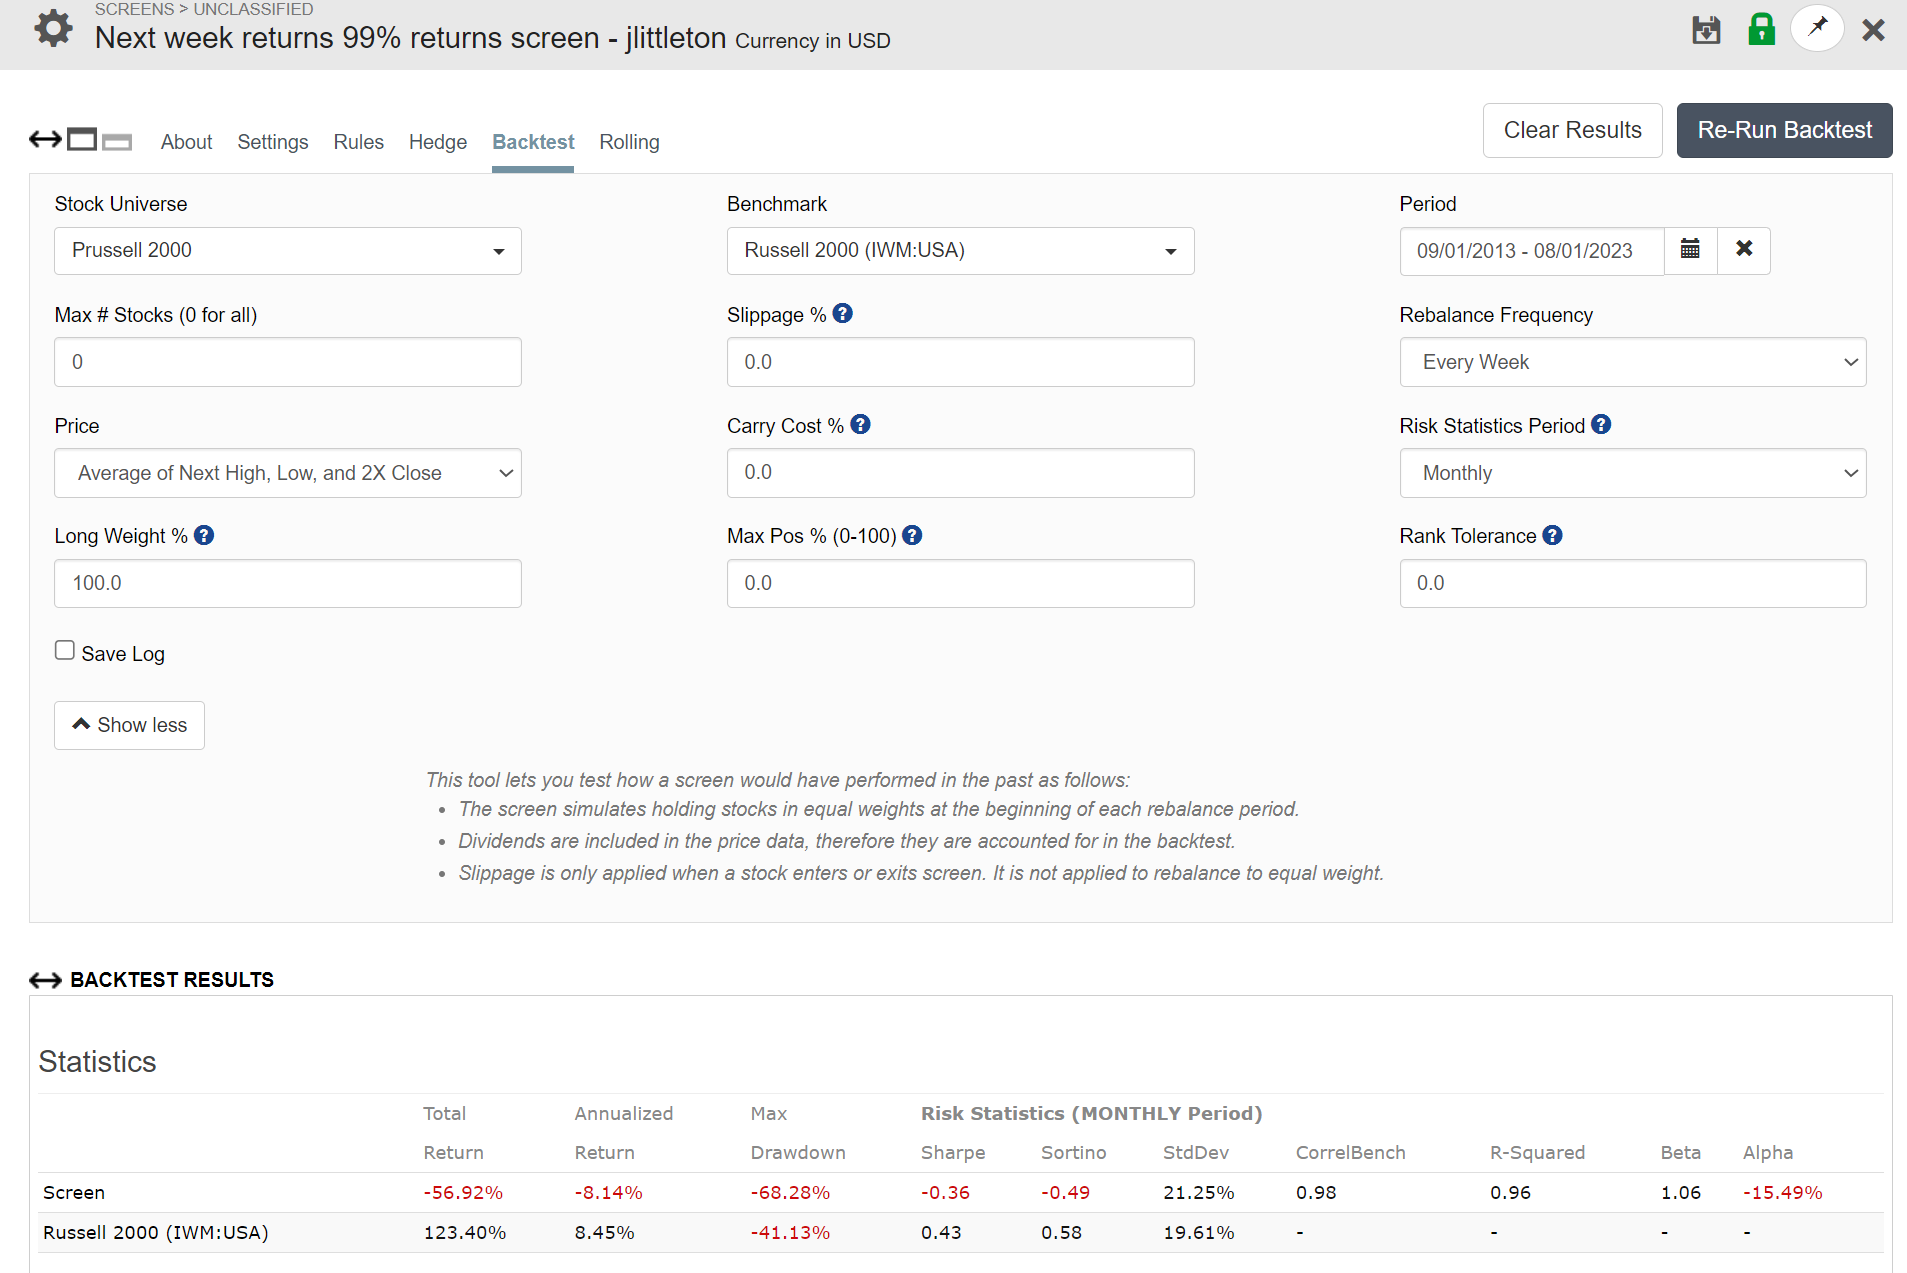
I am looking at the Prussel 2000 universe with this screener rule such that I remove the top 1% best performing stocks every week:
FRank(“Close(-6)/Close(-1)-1”)<99
And the result is that is way underperforms the total index (-8% vs +8%). So the top 1% per week returns are generating that +8% per year. Or I am making a big logic mistake somewhere here.
But if it is real then does that mean most stocks loose value over time?
Also if capping and trimming has such a large effect on the universe returns over
a long time period maybe its better to optimize to a average weekly or monthly alpha instead of annualized alpha?
Not sure myself without research or looking at your data.
Stock market returns are skewed and not normal. Said to be “log-normal.” So a change in the direction you are noticing is expected. I agree though: surprising how much.
I would re-run without the trim as a first way of trying to be sure what is going on.
The other thing is, if you are using the ranking system to find stocks with a rank of 99 or above then with a good ranking systems aren’t you hoping to capture a good portion of the top 1% of stock returns?
I do not trim. But I do use large samples that minimize the effect of the outlier. I do like to think (hope) that my system finds some of those “outliers” and I have not excluded them yet.
Not to suggest that I will not find a reason to do it in the future.
The screen is showing the correct result. Take out the top 1% of performers and the overall return will be negative. Include only the top 1% of performers and the overall return will be close to infinite. This is indeed the result of the fat-tail distribution of short-term returns. The real problem when you trim the top 1% is that those stocks often fall the next week by an equal amount. So what you should be doing if you want to trim egregious returns is Between(FRank(“Close(-6)/Close(-1)-1”),1,99). Then the benchmark is positive. Better yet might be between(FRank(“Close(-6)/Close(-1)-1”),0.25,99.75).
My advice is not to trim individual stocks unless their performance is distortional (so low or so high that they overwhelm portfolio/universe results), and in that case just cut them from your universe. Personally, I only trim overall portfolio and/or universe returns, not individual stock returns. I use an ellipsis of confidence for this. An easier way is to just trim the top and bottom X% of weekly portfolio returns before measuring alpha.
Just to add, for the easy to trade universe you would be trimming over 30 stocks per week or calling 30*52 or 1,560 stocks outliers each year! More than the size of most ports each week.
That would make me wonder what my own exact definition of ‘outlier’ is.
But for sure there will be some real outliers in the 1,560 stocks. Their effect will be diluted if you keep things like your min_child_weight in this ballpark (I hope). But maybe some outliers will need to be removed. We have seen ridiculous sim results because of some extreme outliers that P123 has reported to FactSet.
TL;DR: I have trouble calling 1,560 stocks outlier each year (31,200 for a 20 year sim) and I don’t think I am disagreeing with previous post (I would not disagree if I thought I was).
I never realized just how much the fat tail dominates returns on a short time period like 1 week. Also totally agree that trimming 1% is a lot for a universe around 2-3k stocks.
The reason I had originally looked at trimming the 1 week gain per stock is that there are a few stocks that do about 10x in one week, which seems like it would have a high potential to distort the optimization of a system. I also found that I would get better XGBoost out of sample returns when I removed or capped these.
However, I think you are both right that it is better to account for their impact another way like trimming portfolio returns when measuring performance instead of stock returns or a large min_child_weight in XGBoost. Or maybe I just remove the 2-3 instances where the returns are really high, say over 5X in one week if I want to use it for ML.
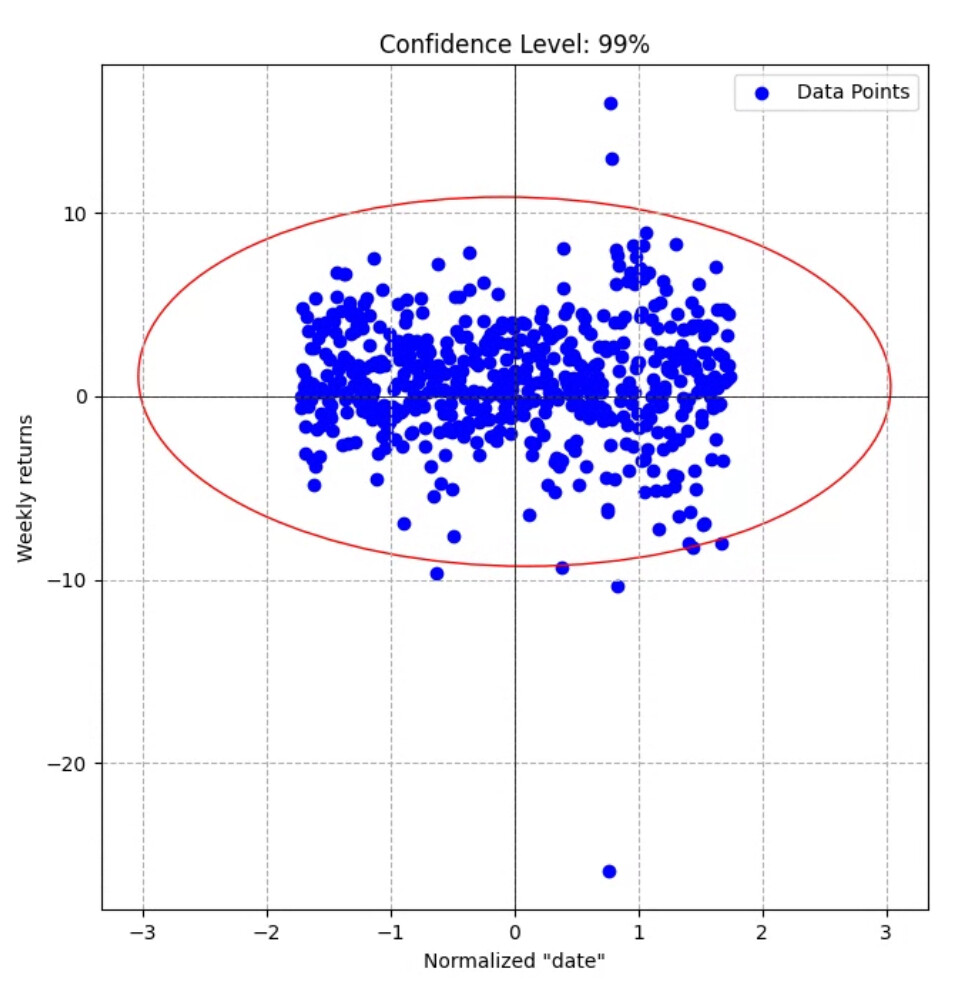
I implemented what I think is an ellipse of confidence (per Chatgpt…), but my returns increased. Which is the opposite of what I expected. Here is a plot of the trim:
Maybe the ellipse trim should not be done on weekly returns vs “week”. I will have to think about the implementation more… Or switch to the simpler trim the top and bottom X%.
I kind of like it just looking at it. I missed that extreme lower outlier the first 5 times I looked at it. But this outlier probably needed to be trimmed and generally you are not trimming a lot.
It is also pretty symmetrical in the trim. Perhaps not introducing a lot of bias either way (for ir against a model or the expected return).
Even if you can’t find a story to exclude the extreme outlier there is no reason to think a one-time event like that would occur again and it could be a positive outlier the next time at that.
There’s something very odd about this: the x values are delimited by -1.8 and +1.8. It looks like you’re trimming something that’s already been trimmed. This is not at all what an elliptical trim usually looks like. Elliptical trimming is only useful if there’s a pretty clear massing of returns in a line; it gets rid of outliers that are likely to affect the formula of the line. That’s not the case here. With data like this (if it’s raw and untrimmed), I’d recommend either not doing linear regression or applying a smoothing process. For example, you could order the paired data by x values and take the median of every ten data points and see if you get anything worth regressing.
I was looking at weekly % change vs the week (that I had to turn into a number thus the strange bounds). However, using the ranking system performance vs the universe performance makes a lot more sense. I should work on this earlier in the day when my brain functions better haha…
That being said, is a point like the -20% weekly change in both the universe and the ranking system really an outlier? I would guess than was from the 2020 crash.
Do you see how that point at the bottom left could have an outsized affect on a linear regression? The 4 point at the upper right too.
I am not really sure if you should remove those points or not. But Yuval has a point, I think. That is what you should be considering. The outsized effect of 5 points total on the results of your linear regression.
Actually, there are more than 4 points if you look at the points just outside of the oval. I wonder about a 99.5% confidence oval.
Just thinking out loud but I would consider removing them for a linear model. Maybe keep them for XGBoost. That is just based on looking at your post and what I did with XGBoost a while ago. You will be able to gather more information.
For XGBoost—if you are still doing it—you need to look a Huber loss. Do a k-fold validation with Huber loss an without it and be on to the next thing that interests you.
When you can do it, k-fold validation answers these questions for you.
Now I see how the trim is useful for a linear regression. It took me a while to get that you can calculate alpha and beta from this plot of portfolio returns vs universe returns and that it is not just for trying to get a more realistic sim return number. I had to go look at previous posts about ellipse trimming to get that.
Thank you both for all the help! I know I have lots more to learn, but I feel like I am adding a lot of good tools to my factor investing toolkit.
Also I have set aside XGBoost until I can develop the python tools I need and make sure they are robust. I also need a cleaner and larger ranking download. Hopefully I will be able to get back to it later this month. That is to say there is still a lot of lower hanging fruit to get first (XGBoost it turns out is not low hanging fruit...)
Me too. I want to do things that can be plugged into the ranking system first. While I explore random forests in my case. I’ll try to emphasize some to that in future posts.
Than makes Elliptical trimming a pertinent topic for you, me Yuval and others perhaps.
I think I may have seen Elliptical trimming before but had forgotten. Thank you for re-introducing it!
I have been using elliptical trimming because it’s not very hard to do in Excel. However, there are certainly better trimming algorithms available in Python. The gold standard seems to be DFFITS, which is more or less the same as Cook’s Distance (DFFITS - Wikipedia). DFFITS tells you how much influence each point has on the plot; you can then exclude points with an outsized influence.
I have also looked into robust measures for alpha and found your “trimmed alpha” technique.
What is your motivation for trimming negative outliers. If a strategi tends to find stocks with huge drops from time to time don't you want that to be reflected in your measure?
I honestly haven't experimented with trimming only positive outliers: it hadn't occurred to me to do so. It may actually be a good idea, for precisely the reason you state. Thanks for the suggestion: I'll investigate whether trimming only positive outliers improves forecast accuracy or not.
I’ve been using another evaluation target: median-alpha@20pct.
For each rebalancing date, I take the top 20% of ranked stocks, compute the median 3-month return of that subset, and plot those median returns against the benchmark returns for the same periods.
Then I run a simple linear regression and use the intercept (alpha) as the performance metric.
It’s quite a robust target: it tends to produce a steady system that slightly outperforms the market on most days, rather than chasing occasional “rockets.” It rewards consistent, moderate gains across many rebalancing periods rather than relying on a few extreme outliers.
@yuvaltaylor , I know you have a framework for estimating out-of-sample performance across different targets. I’d be curious how this one would compare with trimmed-alpha.
I'd have to test it, really, which won't be easy. But it sounds terrific. Do you use this as a target for the AI factors? If so, how do you write the formula? The "top 20% of ranked stocks" part seems hard to code to me. Or do you just use 3MRel and then use this as a metric? Anyway, I like the way your mind is working here. It sounds very robust.
What's most important to me is how predictive a measure is. I've found trimmed alpha to be the most predictive of all measures I've tried, including median excess return, which is quite predictive and a bit similar to what you're doing. But I like the idea using median returns to calculate alpha, and I'll give that a shot.