Review of my First Generation Ranking system

When I first came to P123, my knowledge of quantitative analysis was more limited, but I did know about “momentum” and “value” as being factors likely to deliver above average returns (alpha).

Specifically, from reading books such as “What works on Wall Street”, I determined the best factors for value were price-to-cashflow and price-to-sales, perhaps because they are less often looked at than P/E ratios. Anyway, my own research suggested that 6 month relative strength was the best “momentum” factor, with shorter and longer factors also work reasonably well.

I used to screen for stocks based on price-to-cashflow, price-to-sales and 6 month momentum, and typically had a 20% trailing stoploss.

With this in mind, I went about creating a ranking system that I have retro-actively called “First Generation” ranking.

Although I have sinced moved on, and now have the more sophisticated “Third Generation” ranking (see: http://www.portfolio123.com/mvnforum/viewthread?thread=2837 ), I have decided to revisit the first generation ranking.

The main motivation is that this ranking system was first created nearly a year and a half ago, and this presents an interesting opportunity to study “in sample” vs. “out of sample” performance.

In creating the ranking system, I attemted to verify (or falsify) what I already knew: - the best momentum was 26 week, and the best factors were price to sales and price to cashflow. You can see the ranking system here:

http://www.portfolio123.com/rank_details2.jsp?rankid=26995

You can see the “old” factors that I considered that have now been zero weighted. One thing I did not know prior to P123 was the relative importance of “most recent quater” vs “trailing twelve month” data. There are arguements in favour of both - TTM data is unaffacted by seasonal varations, and is less “noisy”, it isn’t destroyed by a single “freak” quarter. However, most recent quarter data is more “fresh” and empirically it appears to be a better indicator, so I always use that now.

The sim that I used was based on a 20 stock portfolio, with simple rules, a 20% stoploss (from high) and a rank< 90, rough in line with how I used to trade prior to p123. Here is the portfolio:

http://www.portfolio123.com/port_summary.jsp?portid=338089

Its quite a reasonable performance, and I thought it looked fairly satisfactory, there had not been a great deal of optimisation - just some common sense and a few “tweaks”. So I decided to create a portfolio to “paper trade” it and observe the results. Here is that portfolio:

http://www.portfolio123.com/port_summary.jsp?portid=186885

As you can see, quite disasterous. In many results this should be taken quite seriously by everyone following quantitative strategies - even ones that appear to have little curve fitting can it seems simple “die”.

Or can they?

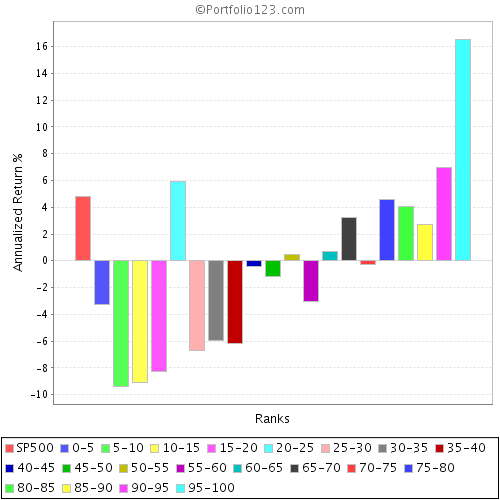
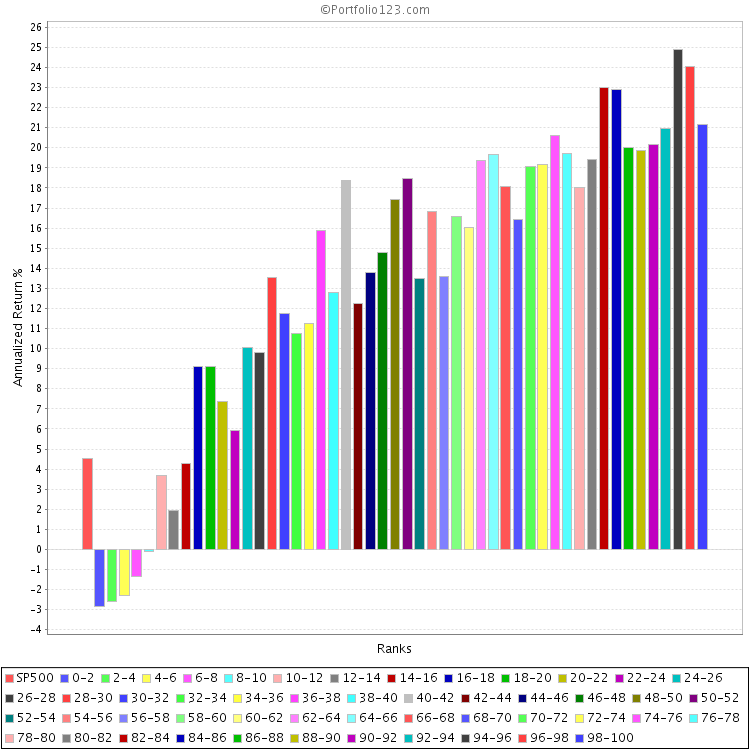
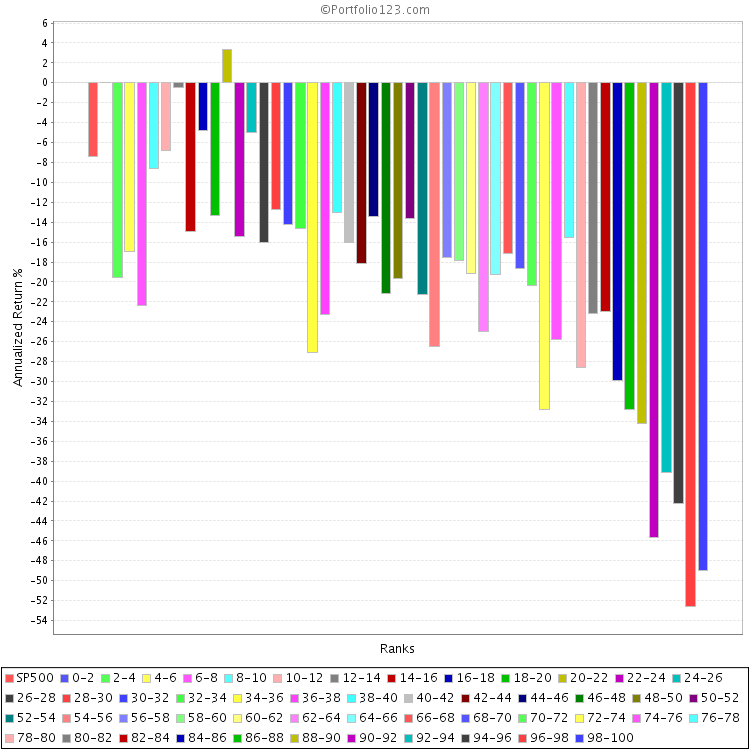
I had written off this process as being “too simplistic”. But then I looked at the ranking buckets of the system in 2007. With 20 buckets, in 2007 the top bucket did outperform the next one down, and so on and so forth (see picture). This leads to a very interesting conclusion:

The portfolio had failed to deliver real time performance but the ranking system had not

This to me is a paradox: The portfolio had not delivered above average returns, yet the ranking system itself was still predictive of “alpha”, and was still able, in 2007 to rank and select stocks likely to deliver above average performance.

This actually has been a complaint of many attempting to follow “value” strategies. They have noticed that buying stocks with low p/e ratios etc. is often a losing strategy, yet acedemics insist it should be a winning one. Perhaps the issue is this, if you really want to get the performance of the bottom decile of value stocks/or whatever, you need to buy all the stocks in the decile.

Given a stock universe that is sufficiently liquid is probably 5,000-7,000 stocks one twentieth of 5,000 is 250. At least 250 stocks are sitting in the buckets when looking at 20 buckets.

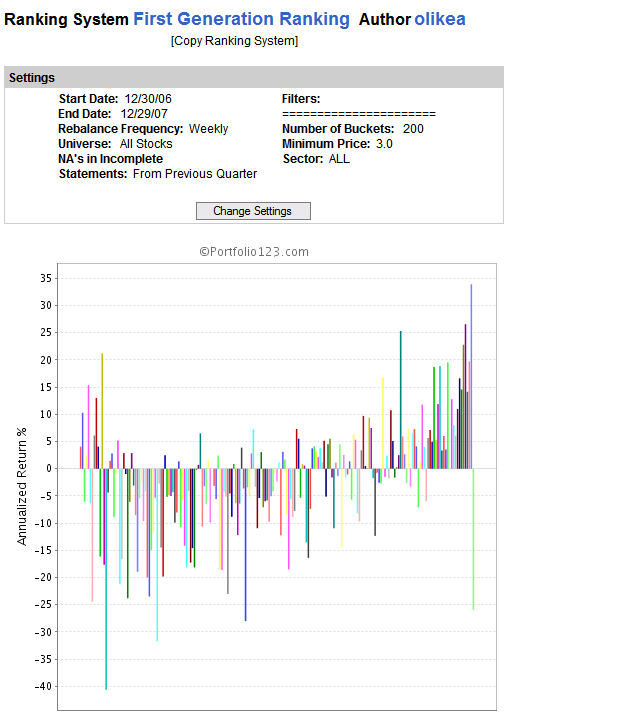
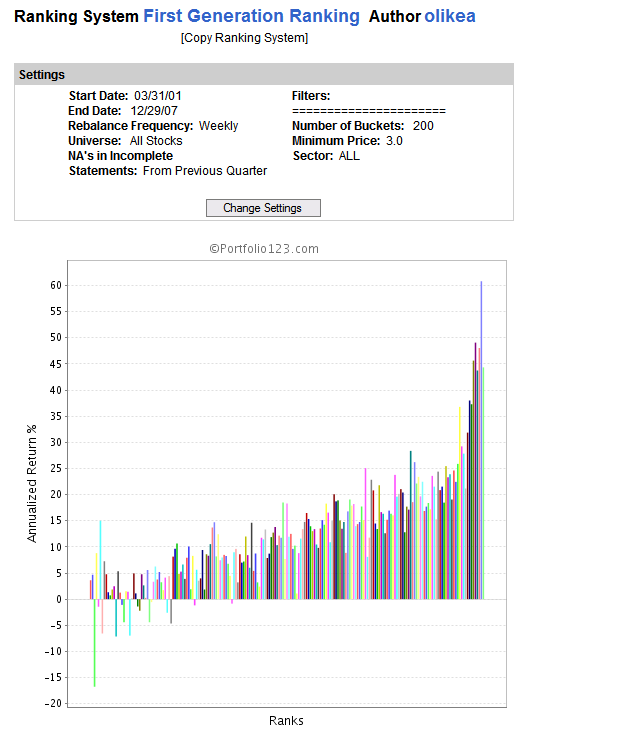
Of course, you can visually see that if you ask for more buckets, such as 200 buckets, the results are much more variable - more random. Although it may be tempting to optimise and create a top 199th percentile bucket, the fact is a lot of the perforamance may be down to luck.

Nevertheless, I decided to test by re-running the simulation over the out of sample period (2007) but varying the number of stocks being held, all the way from 20 (in the original) to 300 (which should be the top 5th percentile bucket).

Here are the results:

http://www.portfolio123.com/port_summary.jsp?portid=338056

Above is the “original” port, with 20 stocks. It total return was -16.68%, an “active” return of -20.33%. In short: Pretty miserable. It lost more money than every index over the year. Arguably a better benchmark would be the Russell 2000, or even the Russell 2000 value, but for simplicity I stick with the S&P500, besides I don’t believe you should simply change your benchmarket to cover up poor performance!

http://www.portfolio123.com/port_summary.jsp?portid=338058

This is a carbon copy but with 50 stocks. Total return: -3.6%, “active” return: -7.2%. Still a poor result, but better than the 20 stock portfolio.

http://www.portfolio123.com/port_summary.jsp?portid=338059

Ditto with 100 stocks. TR: 5%, AR: 1.3% - this portfolio interestingly performed almost exactly in line with the market. By now you should be seeing a trend:

http://www.portfolio123.com/port_summary.jsp?portid=338060

In a tough year for value strategies, the 200 stock port convincinvgly outperformed the market: TR: 10.7%, AR: 7.0%

http://www.portfolio123.com/port_summary.jsp?portid=338061

I went to 300 stocks as well, but it looks to be “over the peak” as it were, with TR: 9.2% and AR: 5.5%. But interesting how the 300 stock portfolio did outperform the 100 stock portfolio.


This really is interesting - it implies that “alpha” is possibly far more elusive than we give it credit for. You really have to make a large number of bets, and on a statistical basis, hope to outperform.

Perhaps this shouldn’t come as too much of a surprise. If it were really easy to generate alpha more people would be doing it, and in turn destroy the very inneficiencies that they seek to exploit.

This does tend to re-affirm my increasing belief that quantitative analysis works best with very large stock portfolios, picking up on innefficiencies that are too small and too subtle on a stock-by-stock basis for the majority of investors to spot.

That is my interpretation, but I am quite keen to hear other views on this (important) issue. Have I missed something?


firstgenranking2007minliquidity.png

Oliver,

Very good post. And very revealing. Thanks for sharing your work.

I believe the difficulties that your ports were having stems from the trailing stop sell rule. Trailing stops like this are good for trending markets. 2007 was obviously not a trending market, especially for small and mid caps. For sideways markets like we saw last year, trailing stops likely cause you to sell near an intermediate low.

In sideways markets, I like to take quicker, smaller gains. e.g. one way to do this is to buy at an RSI dip, and sell at an RSI high.

Just my opinion.

Brian

I have discovered in 2007 that the buy and sell rules of Sims/Ports are more important than I gave credit to. I have a few ports based on a ranking system that did not perform well over the last 6 months of 2007, however the buy rules rescued me and still produced a decent profit. The sell rules are equally contributing to this.

I now believe that my Port/Sims need to have the folling buy and sell rules to make them robust (as opposed to the view that too many rules may lead to curve fitting):

Buy Rules

  • Rank>99 & Liquidity & min price level
  • one or two fundamental factors usually minimum levels or comparisons
  • one technical factor focusing on reducing the number of stocks during a downturn in the market. The effect of this type of rule is that during the downturns no stocks are additionally bought. I have stopped dip buying technical factors as they tend to increase losses during market declines
  • one technical factor focusing on reducing the number of stocks when there is high volatility. This one I worked on during the second half of 2007 and appears to be a sweet spot.
  • one rule regulating how to deal with recently sold stocks

Sell Rules

  • Rank<99
  • one or two gain rules. Meaning these will trigger when the position has a profit and something happens to this profit. So I call them profit protection rules. I have found that letting your profits rise without indicating till when will make you sell via a stop loss or via rank and this means often at a lower point
  • Laggard and relative stop loss rules

So Olikea, if I see your buy and sell rules than your dependence is heavily on the ranking system which exploits gains to be made in the market but is very rough and does not behave more precise to the circumstances of the markets and the stocks in the portfolio. If you want to mimic those results than you have to buy a lot of stocks or let your buy and sell rules work harder for the losses you will occur due to the randomness in real trading.

With regards to the number of stocks, I was first influenced with the popular view that 5 portfolios of 3 stocks based on non-correlated rankings is better than one port of 15 stocks. However, also in 2007 I have seen too many boom and bust scenarios of these ports. Some of them I have traded life and seen first a + 50% gain but than I had a series of 10 stocks who each fell 10 to 15%. Statistically this is very possible but when this happens to a 3 stock port the overall results are devastating. I have not been able to test the robustness enough of the 3 stock sims so that real profits are in line with sim results. Therefore, I now stick to sims with 5 to 7 (my latest development) stocks to ensure enough reliability. I must say that my latest private ranking system which I am now developing sims for showed increased sharpe & gain % day when going from 3 stocks to 10 stocks. This of course gave me a good feeling as it shows this is a robust system.

I now also better understand the limitation of our historical database. There is still a lot of randomness in the market and it does not mean that your sim has a paper profit of 150% year that this has any link to the future.

PS: I was down to zero profit for the year in Aug 07 but with the above rules which I implemented to all my ports, I made about 30% profit of my yearly salary. Not enough to stop working but still nice enough to buy a nice new car.

Filip

To a certain extent I agree, but this sim shows that the lack of a stop loss makes little difference:

http://www.portfolio123.com/port_summary.jsp?portid=338091

In effect, the “deep value” has been performing poorly…

I have been moving away from stoplosses, which I view as being rather too blunt, it is better to have momentum in the ranking, then poor momentum automatically takes you out of a losing position:- an issue with stop losses is that a market crash may take you out when it should be a buying opportunity.

Things always so clear in hindsight! :slight_smile: Is there any way to know this other than retrospectively?


Some of my “pullback” strategies are “rules only” require no ranking system… However, my view with technical analysis is that apart from the very short term it is mostly overrated. I have tried to test the “usual suspects” such as RSI, MACD etc. and repeatedly found them to have little or no predictive value, or that they are a proxy for a much better predicator. Eg. distance between 50 and 200 day moving average is much more significant than MACD, and RSI is blown away by a simple rule: down two consecutive days… that is from my own testing anyway.

The problem with buy and sell rules like “stop losses” and “take profits” is that they both slightly go against the grain. A “stop loss” rule works best in highly trending markets, a “take profits” rule works best when markets are highly mean-reverting. If you get caught on the wrong side then you can bleed money as fast as you were making it.

From what I know, it would appear that markets are trending in the long term, and mean-reverting in the short term, an interesting perversion that makes trading all the more challenging. By using long term moving averages, they act like a low pass filter and you can get rid of all the short term noise (that you may actually want to fade). From the point of view, a stop loss may take you out of a trade for all the wrong reasons, but then again, at some point you have to say “the trend has changed”. Arguably this is why I like using ranking systems to chose, they are much more adept because they are solving fuzzy logic problems almost like an analogue computer, rather than trying to “crack” a code hidden in the market.

The issue with specifiying “rank > 99” works only if the top percentile bucket is always going to be high performance. This is a key issue that I am addressing - the market may not be so precise. Retrospectively, all ranking systems have their top bucket rank 99, of course! They have been designed that way with the benefit of hindsight! The problem is that as time goes on, the top performing buckets can easily shift around. This does’t mean the ranking is “broken”. Buying “value momentum” is still a winning strategy, but the results are more “smeared out” among the top buckets. If you have a low stock portfolio, you run the risk that you will have devastating returns.

It is a point I take, but the problem is that I don’t really have any explicit buy/sell rules that really do seem to add value. There are simple technical ones such as “sma(50) > sma(200)” but these can be built into the ranking system instead, and arguably this is better because then it allows you to buy stocks with high relative strength even in a bear market (you may want to do that - rebounds can be strong).


Ultimately, it never ceases to amaze me just how “efficient” the market really is. Just how much randomness there is, and when stock prices look “undervalued” (on a qualitative basis) it often later turns out the market “knew” something I didn’t, or quite a lot of people didn’t as the new information sends the stock price cascading lower. Again, often when you are making money, when you think you are generating alpha, it turns out to be beta instead, some “hidden risk” comes up to bite.

It has often been argued that the collective wisdom that goes into stock prices exceeds the wisdom of any particular individual; the best forecast of the stock price is the stock price itself. Therefore I do worry about getting too caught up in stock specific issues. If indeed it is possible to analyse individual stocks and make reasonable predictions (even with buy/sell rules) then I am all ears. But I am not sure that it is.

My feeling is that the only way to beat the market is through a disciplined quantitative approach, seeking to capture the inneficiencies that have fallen through the cracks, and this is only possible with tools like p123 and its ranking systems.

My feeling is to try and move away from trying to make specific bets on individual issues, and move more towards an “intelligent index”. Given how index funds beat 80% of fund managers, if you can design an intelligent index that beats the vanilla index, then you beat 99% (?) of all fund managers.

But really I still don’t know. I am open to ideas on the subject of how we use p123. Given how low cost brokers have become, running large stock portfolios just isn’t the issue it was in the past. Question is: Is that the best course of action?

Something I am exploring is trading the same stocks in two different models - i.e. trading in different time horizons. For example, if you have a core list of stocks that you hold in a trend-following system, and you also trade the same stocks in a short-term volatility system, you can be prepared for either type of market. A strong ranking system could give you the list of core stocks. This list could be updated on a monthly or quarterly basis, the trend-following system rebalanced on a weekly basis, and the volatility system on a daily basis. I’ll post some of my findings as I go through my testing with this.

Filip,
Nice comeback. Any chance you would share some examples of your buy/sell rules? I am especially curious about your comment on volatility. I have wanted to try testing rules with benchmark volatility but do not know how to measure it with the functions available. In my testing I have found that the buy/sell rules are more important as the number of the stocks in the sim are decreased, particularly in sims with less than 10 stocks, and I am too big a believer of diversification into multiple strategies to trade larger ports.

The best rules I have seen so far to limit stocks bought are:
Pr4W%ChgInd > 0
benchclose(0) > sma(50,0,#bench) or benchclose(0) > sma(200,0,#bench)

and
MaxCorrel(100,1) < 0.25
also tends to be useful.

On the sell side
GainPct < -10
PctFromHi < -20 + (GainPct/5) + (100-Rank)*75

This last rule combines rank, profit taking, and stop loss. I vary the numbers depending on the size and aggressiveness of the sim.

Don

I put in the extra rules as suggested, and they seem to make the performance worse:

http://www.portfolio123.com/port_summary.jsp?portid=338334

I guess this is the problem I have with “common sense” type rules - they work until they don’t. It is a bit like breakout following, worked well, and then it doesn’t anymore, and people like Dennis who got caught up in it made nasty losses.

I am open to other ideas, but I don’t like the inflexibility of rules, I think ranking systems are much better because the way they attack the problem is much more subtle, and “fuzzy”, and given how others are less likely to do this, it can be a problem.

I think a stop loss rule seems a bit arbitrary on the whole, sell after a 10% decline, but decline from what? When you got in? If you wouldn’t always avoid buying stocks within 10% of their all time highs, it doesn’t make sense to have a 10% stop loss.

Olikea,

This is an interesting discussion you put forth (like always!). You do a good job of keeping us thinking.

Don’s rules have some merit. His rule; PctFromHi < -20 + (GainPct/5) + (100-Rank)*75
Has a typo in it. The last factor should be more like; PctFromHi < -20 + (GainPct/5) + (100-Rank)*5.
You also left out the Rank rules. In your Sim I add Rank > 99 buy rule, Rank < 99 sell rule, and make the correction in the rule above, and I get an improvement in the 1 year Sim to equal the Market return. Still it is not a very good return, has higher turnover, but a significant improvement on your original Sim for 2007, and is partially out of the market during the corrections.

http://www.portfolio123.com/port_summary.jsp?portid=338352

Denny :sunglasses:

Hi,
I think it is an interesting challenge, to see what buy rules can do for a ranking system that is underperforming. I am surprised to see the rules show such a benefit for a 20 stock sim. I have always viewed the rules as a way to control risk for a sim with only 3-5 stocks.

The following is a 5 stock variation without the added buy and sell rules:
http://www.portfolio123.com/port_summary.jsp?portid=338373
Annual return of -43% and drawdown of -56%.

Following is a 5 stock variation with the added buy and sell rules used in Denny’s sim:
http://www.portfolio123.com/port_summary.jsp?portid=338376
After a runup early in the year the 5 stock sim ended the year basically flat. Pretty good for a 5 stock sim.

fyi, that was not a typo in the sell rule - that is the parm I use in an aggressive sim/port with an avg hold time of only 20 days. That particular ranking system tends to do well with higher numbers in this sell rule than most. The avg hold time in Olikea’s sim using this sell rule was 7 days so clearly the number was way too high for this strategy, so I did some backtests over 2002 thru 2006 to select parameters that were reasonable over this period and came up with this:

http://www.portfolio123.com/port_summary.jsp?portid=338381
104% AR, -22% DD. (wouldn’t I have liked to have been trading this strategy over that time period). Note that I removed the 10% stop loss in this strategy - that rule works in some aggressive sims but I don’t place a 10% stop loss order on small cap stocks. If at the end of any given week they are down more than 10% from my buy point, I sell them and move on to something else.

So now the real test, how did this strategy do in 2007:
http://www.portfolio123.com/port_summary.jsp?portid=338387
Annual return -15% and a drawdown of -36%, so the buy rules did effectively reduce risk but did not turn a losing strategy into a winning one. Still, the rules in this strategy were very effective in 2002 through 2006 so not in any way optimized for 2007, and they added significant risk protection to this strategy in 2007.

Basically the buy/sell rules provided risk protection similar to that provided by the diversification of a 20 stock sim (Olikea’s original sim in this thread). I think that is really the goal with these strategies, to capture the upside of a small portfolio without the downside. And that leaves me free to diversify into a number of other strategies.

Don

This is interesting. Lots of good stuff in this thread. :slight_smile:

I suspect there is an issue with 1st gen ranking system that is separate and distinct from Buy/Sell rules.

Olikea, I ran your 1st gen ranking system under conditions of:

200 buckets, $3 min, 1wk rebal, entire universe

From 12/30/06 -12/29/07 return of top bucket is -26%
From 3/31/01- 12/29/07, return of top bucket is +61%

For some reason, in 2007, the topmost bucket really imploded negatively. Not so much for the lower buckets, but definitely for that top most bucket. This can only be seen by using 200 buckets. If you use the default of 20 buckets, the negative returns of the top bucket are averaged out and are not seen.

What a difference!!! The ranking system imploded in the past year. Since by design, we want to buy the highest ranked stocks, It is hard for me to imagine how any buy/sell rules would turn this negative past year performance around.…or perhaps they did, just by brining the sim up to breakeven for past year.

Now what I also find interesting is that AAII reports that O’Shaughnessy - Tiny Titans screen had a YTD thru Nov 31 return in 2007 of just 1.5%. (As Olikea has mentioned in older posts, Tiny Titan approach is related to this ranking system). So, it must be that this approach of low P/S was simply out of favor in 2007…which is not surprising given the heavy publicity it has received.

All of this drives home again the perpetual and global question of how in the world do we tune and set the parametrers of a ranking system and have confidence it will have at least some amount of positive performance going forward.Unfortunately, I experienced more than I would of liked to experience some of this with negative real $$$$.

This also reminds me to mention that I am still very interested in tools that will allow for more systematic development of ranking systems. For instance having a script that will automatically look at different regions of time and break out the performance would be useful.

Kurt


Don, I am intrigued but not fully understanding your comment.

Do you do this in all your ports, eg. sell everything every week that is down 10% from buy point? If so, why do you remove the TS from your SIM?

Do you find that selling all those losers ends up giving you better performance?

In real life, I have been letting the higyhly ranked small caps drift down to 25% loss before I consider selling them. To be honest, this has not been a good approach…I have lost money. So I am intrigued by your comments.

Thanks!

Thanks,
Kurt

Hi,
Sorry, I wasn’t very clear. Since the last strategy did not back test well with this rule, if I was trading this strategy I wouldn’t sell a stock just because it was down 10%. I generally use a trailing stop of 20% on my positions, and even that may be too tight. I would rather sell a stock based on the portfolio signals then on a stop loss. In backtests stop losses almost always hurt performance, but for sims with 3-5 stocks, the gainpct < -10 rule sometimes reduces risk (drawdowns) and sometimes it even improves overall performance.

Don

Yeah, you have hit the nail on the head:- it is something I mentioned in a previous post: http://www.portfolio123.com/mvnforum/viewthread?thread=2922

Just to take a look at exactly what has gone one, I am attatching two graphs, one showing the buckets of P/S startegy up until 07/07/07 (when the “trouble” started), and one afterwards.

What you see is that a deep value low P/S strategy has completely “crashed”. Some may put this down to “economic rotation” etc. but I have a more simple hypothesis:

I believe we may have witnessed a mini-bubble in this particular quant factor:- it has worked so well, that hedge funds et al have been piling into long/short strategies based on P/S, in turn, their own action has “confirmed” the result, leading more and more money to flow into the strategy. As a result, the entire trade “long low PS/short high PS” has become overbought, even “overvalued” if you follow.

With the catalyst coming in July, with the liquidity problems were the tipping point for the bursting of this bubble. Hedge funds started to unwind their long/short positions, which caused the positions to move against them, in turn causing them forced liquidiation, and leading to a greater spiral.

Take a look for example, at how “Short Candidates” has performed in real time:

http://www.portfolio123.com/port_summary.jsp?portid=250092

And a more specific simulation shows what has happened since July 07, with 20 stocks for more statistical significance:

http://www.portfolio123.com/port_summary.jsp?portid=338408

You would have made a lot of money by doing the exact opposite of conventional wisdom.

My theory about a bubble in low P/S stocks is perhaps easier to accept than a bubble in low P/E stocks - it is quite difficult for a low P/E stock, or specifically low P/E stocks to be “expensive” as a group (there may be stock specific issues with declining fundamentals). By definition low P/E implies cheap.

Arguably low P/S does not necessarily imply cheap - investors cannot “eat” sales, and arguably have worked well in the past as a valuation factor because they have been a proxy to “earnings potential” or more specifically “currently unrealised potential”. But as a group, low P/S stocks do deserve to be their ratios - they may have low margins, poor quality etc. etc. As a result it is conceivable we have witnessed these “low quality” issues being bid up way too far, and now come crashing back down.

This does serve as a warning about chasing hot trends - you may unwittingly end up playing in a bubble, and although the degree of sophisticaiton that computer-driven portfolios brings us, ultimately it is an illusion: tulip bulbs all over again.

So what is the answer to this conundrum? Well, partly I believe more factors, specifically uncorrelated factors (growth and value, value and momentum etc.) part of the reason for Third Generation.

The reason for the poor performance of the very top bucket of the First Gen ranking system is down to the crash in P/S stocks. Because P/S has been such a strong factor in recent years, most ranking systems contain it, and worries about poor performance of value based strategies are what lead me to devise non value based strategies, useful diversification (see: http://www.portfolio123.com/mvnforum/viewthread?thread=2851 ).

I guess my main point though is this: Despite the crash in low P/S strategies, the fact is that if you were sufficiently diversified, you could have overcome this and still had a positive year in 2007 if you had a 200 stock portfolio. This is definately something to think about.

I believe there may be “hidden risk” in a lot of strategies that are being followed, if other people are in the same trade, then bubbles are suceptable to forming. Although initially they will start out as a geniune inneficiency, it is possible that as everyone starts to jump on the bandwagon to exploit the inneficiency, the result tends to “overshoot”. A 200 stock portfolio is lower risk than a 10 stock portfolio, whatever the backtested drawdown statistics happen to say.

Anyway, pictures speak a thousand words, take a look and be amazed:


Really interesting stuff you and others post here, olikea.

No doubt. Small Value stocks were generally kind of “Out of Favour” last year.

But I’m not so sure whether the failure of certain value based strategies can only be attributed to a low P/S ratio.

O’Shaugnessy’s Tiny Titans looks for Microcaps with a really tiny marketcap of 25 - 50 Mio. I know that these stocks can generate spectacular gains, but also huge losses.
Just look at the microcap index ETF’s - even those based on Zack’s famous earningsrank.

I personally wouldn’t touch a stock if it does not has at least a marketcap of 250 Mio. or revenues of min. 100 mio a year - but that is my personal opionion.

Small caps, if not related to technology or identified as growth stocks or being an ADR from BRIC or EUROPE, had a hard time last year as well.

But , still one could have made money with Value SC , including those with a low P/S ratio:
Look i. e. at the O’Shaugnessy screen “Smallcap Growth and Value”. This screens main elements are : P/S Ratio < 1.5, positive earningsgrowth over the last 12 month, high relative strength over 13, 26 and 52wk period.

According to AAII, the screen performed quite well, +36,8% in 2007 as per 11/30/2007. Avg.# of holdings had been 25 stocks.
With data as of Dec.28th, the screen brings up 38 stocks.

Other screens, based on certain value criteria , including low P/S ratio, did also well : Graham Enterprising investor, Oberweis Octagon.
In general, of course, value screens performed worse than in previous years.

But when you look at AAII’s value and value & growth screens some standout with higher losses in 2007. One of the poorest performers is a screen looking for stocks with high free cashflow, some other loosers focussed on high ROE and high dividends. The screen produced - 19,8% despite being diversified on average over 30 stocks.

The Muhlenkamp screen, also looking for all the “good criteria” investors like :
high free cash flow, high ROE, low price to book value ( 2), low PE ( < 17), high profit margins etc…

This screen delivered -19.5% last year and only 2% in 2006. it is also diversiefied over 20 Stocks on average.

Here an overview of all AAII tracked since 1998 :

http://www.aaii.com/stockscreens/allscreens.cfm

and their performances

http://www.aaii.com/stockscreens/performance.cfm

It’s no secret, that high dividend stocks performed poorly in 2007 - just look at the High dividend ETF’s, US and international.

Just an idea :
maybe the poor performance of your system had more to do with the general combination and weigthing of certain value criteria in your ranking as you think ?

I don’t know the details of your system, but what the AAII list of screen performances showed me is, that there was no single criteria, like P/S ratio, responsible for poor perfornance. Rather than a combination of criteria commonly considered
as being favourable for value investors - high free cash-flow, high ROE, Low P/E, Low P/S, high Dividend yield… you name it.

But, I think when looking at the screening criteria used with many AAII screens, those which include some strength criteria did better then those relying on fundamentals only.

We all know, that the AAII screen performance statistics have to be taken carefully.
But nevertheless, their tendencies confirm what we found here as well and also what you can see happening with certain strategy ETF’s / indexes ( notably Powershares and some others based on Zacks, Morningstar or other well known stock selection strategies )

So what I take from all that is the old adage, that no system works all the time and a consistent approach for an investor can only be , to be prepared for unconsistency.

AND :
Buying shares of a good company is necessarily also a good investment.

Wish all of you a happy, succesful and healthy new year 2008.

regards
Stefan