Marco,
When we can expect new R2G model presentation in live.
Thanks
Kumar
Marco,
When we can expect new R2G model presentation in live.
Thanks
Kumar
Yes, I also have the same question here as I would like to subscribe to a new R2G but want to check the new model presentation.
We have not started the project. It will start after the release of the current project which we are testing now.
Marco,
it would be great if the new R2G layout would include a measure that shows how steady a model’s capital curve is over time. I tried to explain this in this thread:
https://www.portfolio123.com/mvnforum/viewthread_thread,8476_offset,0
Cheers, Florian
Hi Marco,
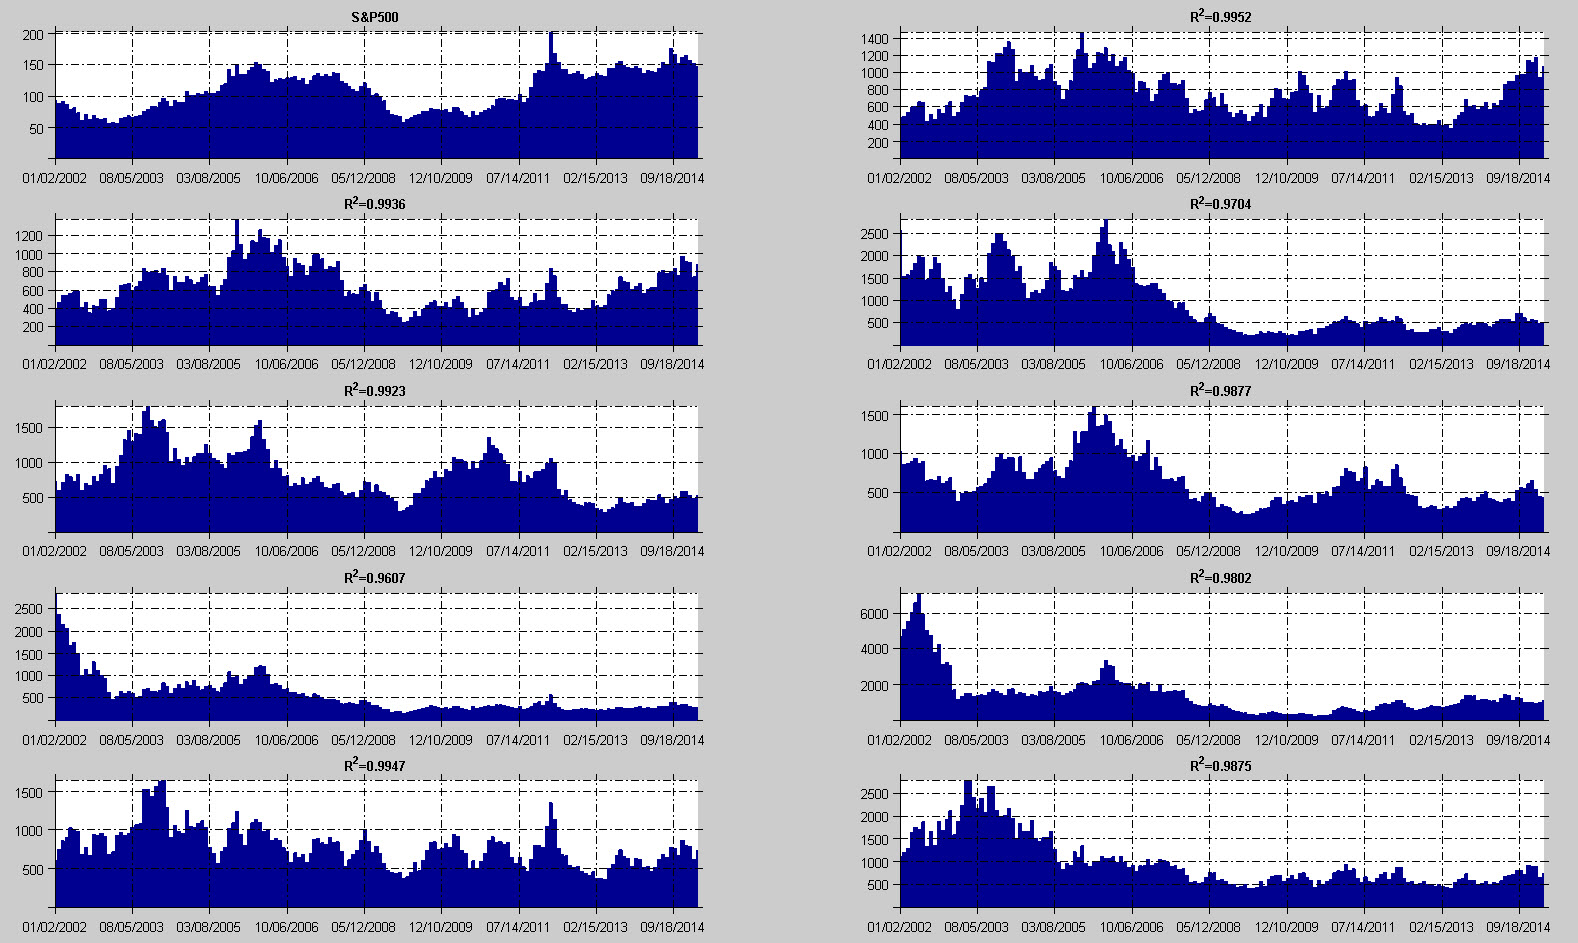
I looked a bit more in detail on the rolling 3 year excess returns that you propose for the new R2G layout. This is a very powerful way to display overall performance and to quickly filter out models that get a high average simulated return purely on some years of extraordinary high returns.
The way the rolling 3 year graph is currently proposed is for an 11 week offset. I think it would be great to have this in shorter sampling intervals, i.e. 4 weeks. I attach some examples of higher resolution (1 month offsets) below. In this case, I plotted overall performance on the y-scale just because it was easier to compute. The plot titles refer to r squared values of the exponential trendline of the capital curve for each underlying R2G.
What do you think? Would it be worthwhile to have a higher resolution? I think it would be beneficial, in particular to highlight periods of low performance currently hidden in models that use market timing.