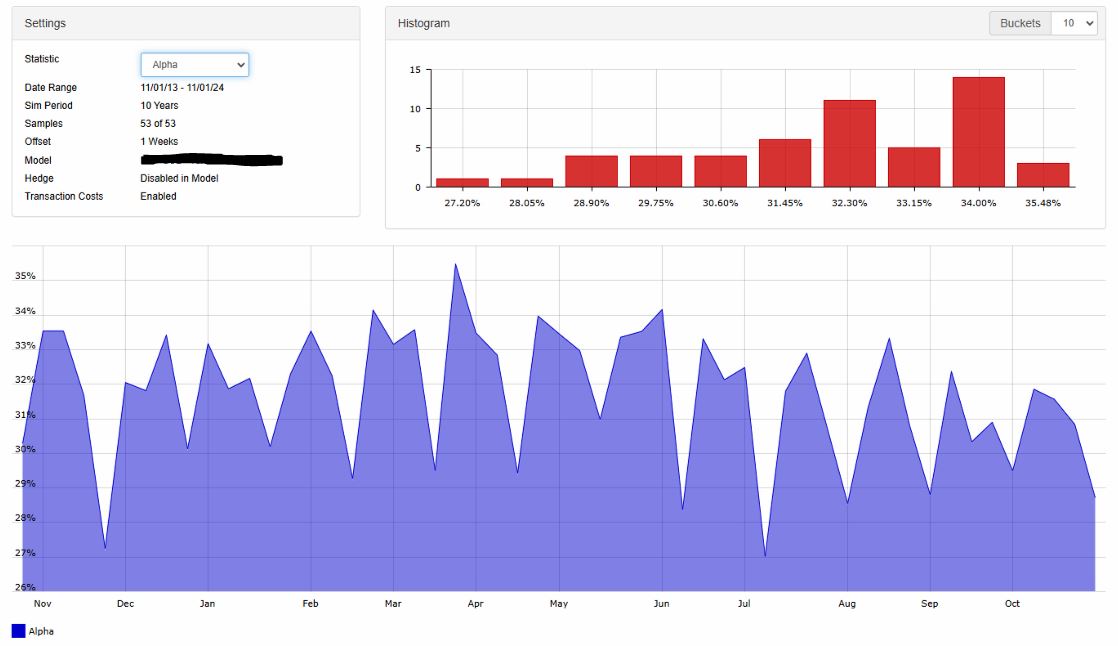
Hi. I have a 20 stocks model with balancing every 4 weeks. I am using the rolling tests to evaluate if there would be a a dependency on the actual starting week of the strategy. I would expect that the impact is minor as 4 weeks rebalancing is still ok to be impacted by specific periods of the year with known cycles (such as the Santa rally or the January effect). However, my model has a significant oscillation. See an example below for 10 year sims for every week of the year. There is no impact of the day of the week, only the week seems to matter and it looks like all the bottoms happen every year during the same week numbers.
What would be the explanation? Is this real or artificial? Is this specific market behaviour that I am not aware of (e.g. option cycles)? Am I picking up local tops in the market e.g. by buying stocks during the Santa Rally? It should have a minor impact as I balance 13 times per year. My model is also 'standard'. My ranking system is not complex. It uses yearly and quarterly data with the Portfolio123 momentum model as the only part using price data.
This is what you would expect from rolling cycles with a four-week holding period tested every week. To make this clear, let's say your model held only five stocks and didn't sell very many during the rebalancing. Think that through, and you'll see that the returns for weeks 1, 5, 9, 13 etc will all be similar and the returns for weeks 2, 6, 10, 14, 18 etc will all be similar too, but there will be a great difference between those two sets of returns. If you up your turnover to 100% a week you wouldn't see this pattern. Also please note that in the purple chart, your returns are all hovering between 28% and 33%, which isn't a very wide range.
Thanks for the insights. So in other words, the 10-year sims that start on weeks 1, 5, 9 ... have (except for a few weeks at the start and end) the same rebalance moments while the 10-year sims that start on weeks 2, 6, 10 ... etc have also the same rebalance moments but always during different weeks compared to the sims that start on week 1, 5 etc. So the 4 sets of sims have similar results but in between the sets there is a difference and as such an oscillating pattern occurs. I was wondering if there are week numbers with under- or over-performance but as you said the range of returns is not very wide so the pattern is probably just normal and within the expected deviation of the model. I have tested different models of 4 weeks and they all have this oscillation pattern but with different week numbers for the peaks and bottoms so there is probably no alpha in choosing the best week numbers.