I heard Wes Gray from alpha architect interviewed on Patrick O’Shaughnessy’s Invest Like the Best, and he said something that rings very true to me … your value model might or might not be better than my value model, but in essence, they’re probably very similar and ultimately what’s going to decide who’s value model has the most success is who sticks with it. So this goes in line with knowing yourself and your appetite for risk, but also adjusting your port with your investment timeline. But I also try not to backtest my way out of too much risk, as I think risk is seen as an asset. As a small retail investor I have two things going for me vs the big money competition … a) I can put money in lower liquid assets without blowing out the bid/ask on the trade. b) I can go through a 5% dropdown day without my phone ringing with angry clients asking what the hell is going on.
How true, how true!
I still recall the time back when I was managing a high-yield bond fund at the time the Drexel Burnam - Michale Miliken, Ivan Boesky scandal hit. I actually got a call form a shareholder who said “Thank God we’re not in junk bonds.” I don’t remember my exaxt answer, but it stated with “Uh…”
I manage my wife’s retirement account. That’s all the client stress I can handle.
Yuvaltaylor,
Great investment books Million copies sold can’t find even 1% of reader following the book concept with discipline and become successful.
All the financial books preaches Return on Equity > 0, P/E < 15,
Mgerstein Cherry pick model follows.
IBD50 front page comes with buy stocks in long term Uptrend on 10 week pullback. (every week the info available atleast for few decades).
I give important to this statement most recently, eventhough, i read IBD news papaer since Jan 2009.
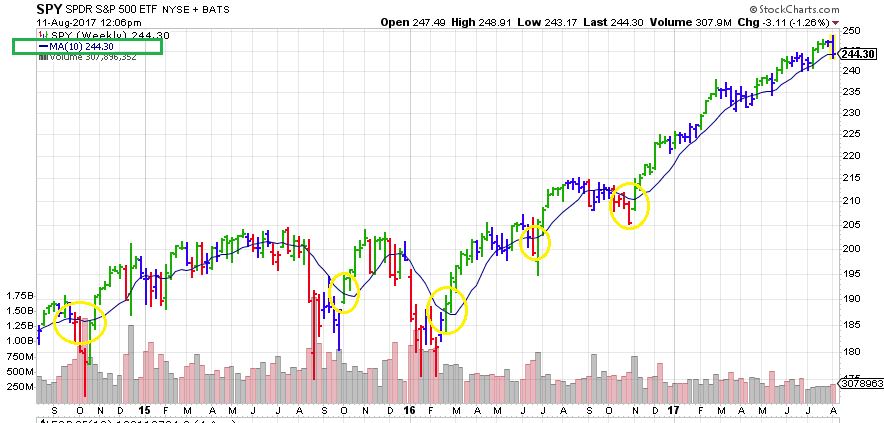
if we see the Jan 2016 draw down on SPY weekly chart, it is a 10 week pullback.
Little things make a difference, if we pay attention.
Thanks
Kumar
Thanks
Kumar
Oh, you’re much braver than I am.
Yuval, Thanks for your insights. This is good. Is there an upper cap on # of holdings you test when looking at these correlations?
Based upon random variance in results dependent on start dates, do you think staggering buy/sell activity makes sense to achieve closer to expected return? For example, for 8 week hold models of say 16 stocks, is there a case that it’s better to rebalance 2 stocks a week than all 16 at same time every 8 weeks? (I’m assuming you’re using fairly detailed buy/sell rules that would override this approach, but for more simple rebalances I’m thinking a staggering process might make sense, but am interested in your thoughts based on your study).
Additionally, one thing I’ve noted is it seems like sometimes start dates can matter - and not in a problematic way where the model works on some dates, and not on others - but in the sense that some start dates really might be consistently better - especially for longer term hold models. Just casual observation, but I’m beginning to think that 3 or 6 month holding periods might tend to do better if they’re setup to rebalance in-sync with the beginning of the year. I can rationalize this might be due to broad investor behavior, or maybe result of how earnings seasons fall, or something similar, but it’s just a vague suspicion I’m beginning to get when looking at longer term holding periods.
Anyhow, just curious. I appreciate any thoughts you might share.
No. That’s something I’ve tested. For example, I did a correlation study to see how many stocks in an eight-year backtest with a universe of about 3000 to 4000 stocks would correlate the closest to a 15-to-20 stock performance for the subsequent two years, and found that the optimal number was about 40, but I did test up to 250.
I’ve never tried staggering buy/sell activity, and really wouldn’t know how to do so. I do weekly rebalancing, as I’ve found I get best results that way. I don’t know–you may be onto something here and I’m curious what you’re doing to make this happen.
This is something I haven’t looked into. When doing tests on longer holding periods, I’ve always used rolling backtests and looked at the average or median excess return, so I haven’t researched when returns are best or worst. I don’t think it would be unprofitable to do so, though.
I haven’t backtested a staggered approach, and I don’t know to backtest it unless maybe setting up a series of mini portfolios in a book if there was a way to time the initial buys and then sell based on a # of bars timing rule? As I work with the data it’s just an idea that keeps coming back to me and something that could be done manually even if not backtested (which admittedly goes against the point of backtesting).
What I see though, is as I run slightly varied startdates in screens and see the various returns (sortof like a monte carlo simulation) I was thinking staggering might help get more of the expected return instead of probability of one of the extreme results. But it might not. I’m currently studying fairly long term holding periods (2mo, 3mo, 6mo, and even 1yr) and the path dependence gets pretty powerful as turnover decreases. It may be that more frequent turnover is just a better solution (seems likely), but I’m exploring longer holding periods at the moment.
one more edit:
I think the underlying opportunity I think is there might be this:
- Varying quality opportunities present themselves irregularly over time.
- Buying 12 stocks at a point in time and rebalancing all 12 stocks at the same time every 6 months means my average rank is going to be 6. I’m getting a long 6 month holding period, and my avg rank at time of purchase is going to be 6. and there’s an expected return associated with that basket of stocks w/ average rank of 6.
- If instead every 2 weeks I buy the top ranked stock that I don’t have, and hold it for 6 months, I’m thinking I can probably still get a 6 month holding period, but my average rank will likely be better than 6. And if my ranking system is discriminating properly, that should equate to a higher expected return. The idea would be exact same low turnover, but accessing better opportunities along the way leading to better expected return. That’s the basic thought anyway.
edit again: I guess effectively the same could be achieved just by replacing the lowest ranking stock in the portfolio every 2 weeks also.