Jrinne, thanks for your thoughtful response. By limiting the split size, are you referring to the number of trees the model trains, or the depth of each tree? My model has up to 8 layers/tree depth, and runs 100 trees in each model.
I do see your point re resolution- my current configuration has it picking the top 50 stocks monthly from s&p500 universe. However, this seems to line up with how the paper is structured (ie it makes many predictions)
I suppose I was a bit surprised that the walkforward did not produce better results, at least something in the range of what the paper put out. The divergence in performance could be due to 1) the long forecast period / predictor variable (12m instead of 1), and 2) fewer parameters for the model to train.
On point 2, current the model uses the 7 factor model (including combo ranking) , trailing returns (12m 6m 3m and 1m) market cap and various forms of momentum volatility and liquidity factors - about 25 in all (vs 100+ in the paper). That said , the momentum and vol/liquidity factors perform best in the paper, so I was expecting better results based on their inclusion in my model.
Chambers,
I am not doing a lot of what you are doing at this time so just some general thoughts.
First, I have looked at random forests, logistic regression, support vector machines, boosting, Naive Bayes and other things for technical data on ETFs fairly recently. Keep in mind that paper used a lot of technical variables so maybe my findings are pertinent. In any case a 2 year window seemed optimal for that. Using all of the historical data (without a window) tended to give the results I already knew (and did not need machine learning to figure it out). An example of what I mean by that is XLY might give better returns long-term than XLU—just look at the equity curve for the last 20 years. Machine learning was able to tell me that when all of the historical data was used (yay machines). A 2 year window could, sometimes, tell me when XLU would outperform (a sincere yay for machines).
BTW, this was a classification model but logistic regression and support vector classifiers (linear and radial bias kernels) were the best performers for my look at ETF classifications. Classified by whether the ETF beat the median return of the ETFs I was looking at that month.
K-fold gave results that just did not work when doing walk-forward (suggesting a problem of look-ahead bias or data leakage with K-fold). So stick with walk-forward if you can. Maybe de Prado’s “embargo” method would make K-fold work better but I have not done that yet. Embargo can be done with not that much Python programming.
I mean “depth of the trees” was limited in the paper. Limited to 6 I think and the author made some points about that. I have not looked at depth as a hyper parameter but setting a minimum leaf size has a similar effect as you know. I spent a lot of time optimizing minimum leaf size when looking at stocks. For ETFs I usually do not set a minimum leaf size (I usually set it at 1).
Maybe it makes sense that ETFs would be different. ETFs already have a lot of stocks in them (averaging the results and reducing the influence of outliers) and some of the market noise is reduced by the fact that the holdings have some similarities (eg utility stocks in XLU might not be influenced by some headline news or at least be influenced in a similar manner).
THE MORE TREES THE BETTER as far as having the best model with the sacrifice of more computer time and/or need for parallel processors. The improvement does seem to level off at 500 trees for what I have done recently. 200 may be adequate and possibly better than 100. You will want to test this and avoid long run times by setting it as low as possible for what you are looking at. It will probably be different for you.
I remain skeptical about beating the institutions (including the ones that may ultimately hire this author) for the SP 500. But regardless, wouldn’t it be surprising if you found something that produced a lot of alpha for the SP 500 on your first run? Do not be discouraged by your first attempts.
I hope that helps a little.
Best,
Jim
These machine learning papers are definitely not the most easy ones to understand. I’m all good with extensions to linear models (OLS) and dimension reduction techniques like PCA. Also parts of generalized linear models as described in 1.5 of the paper make sense to me.
But when they start talking about fixing splines with knots and lasso’s I’m starting to feel a bit like a cowboy lost in the woods (to be precise: lost between regression trees within random forests, so I understand).
What parts of the techniques described in the paper will P123 touch upon with the implementation of their machine learning tools?
I may be missing one and I could not find the link but I am sure Riccardo said regression, support vector machines (SVM), random forests, XGBoost and neural-nets which is a great start in my book! I am sure P123 will respond if I made an error.
LASSO regression is a linear regression method that uses regularization to remove noise variables and prevent overfitting. It is a method mentioned by @pitmaster--who has at least a master's degree in machine learning, has a PhD and does machine learning at a bank (he has a link to his linked in page in his bio). He mentions LASSO regression for good reasons, I believe.
LASSO regression does indeed prevent overfitting. It runs extremely fast without being resource-intensive and has only one hyper parameter. Personally I think it would a nice addition to regression for P123 at some point.
Hi Victor,
I actually used regression splines, I’m not expert but I understand the concept. It is quite useful for testing non-linearity between a factor and response (and risky due to overfitting) .
In short, you want to use regression splines if you assume that there is non-linear (non-monotonic) relationship between a factor value, e.g., FRank('SalesGr%PYQ) and future return.
Then you can divide a factor values into one or more regions e.g., FRank output: [0-50, 50-80, 80-100] and fit a function for each region. The famous knots are simply a region boundaries [50 and 80].
Then you would possibly run linear spline regression to estimate three coefficients for each region. From the practical perspective this involve sorting dataframe by a factor and run more or less sophisticated regression.
Some maybe familiar with transformation: abs(70 - FRank('SalesGr%PYQ)). This is simplification of linear spline with one knot. (credits to Yuval)
The image below show cubic and linear spline regressions (knot is at age 50).
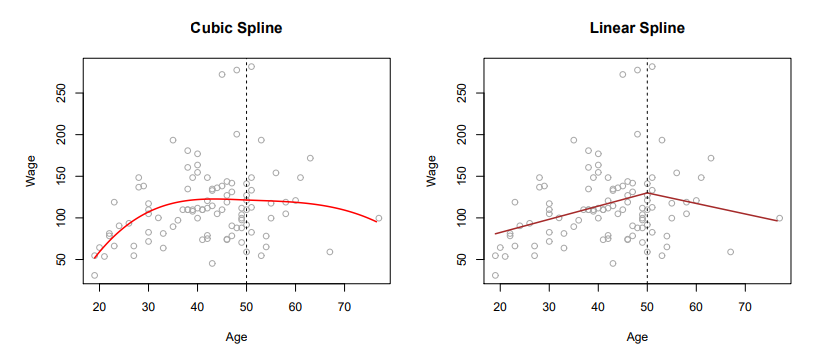
source: Trevor Hastie - An Introduction to Statistical Learning
Thank you, Jim and pitmaster.
I’m still in the process of learning and fully digesting all the new terms that are coming at us. Besides your post and that of pitmaster, I found this older post from Marco that describes (most of the) tools that will be available:
Source: Machine learning, Portfolio123, historical data and ratios - #5 by marco.
I will focus my understanding on these subjects by reading the papers that have been shared by Marco and some posts that I have seen by amonst others you and pitmaster.
Edit: I really like your example of a spline with a knot of abs(70 - FRank('SalesGr%PYQ)), pitmaster. It helps connecting some of the theoretical concepts to what is already being done by some users within P123. Slowly connecting the dots!
Thanks again.
That is a lot of methods. Impressive and exciting.
I would be interested in what @pitmaster and others have to say.
But I am absolutely sure I am not the only one who will want to consider “model averaging”. At the extreme running all of those models and averaging or even stacking the results (probably sorted predicted returns to make a rank).
“Stacking” would be a little hard but model averaging would be trivial. We could probably do it without P123’s help by making each model a node and having the ranking system average the ranks. Probably, it could be done without it being an explicit feature although it could, potentially, be marketed.
But with or out without P123 needing to address it, looking at model averaging (or even stacking) would be an obvious thing to do with such a rich supply of models.
Addendum: So a think a TL;DR is pretty good and leave it to members to go to ChatGPT it they want more information about stacking. Probably for Jupyter Notebooks at home to start.
TL:DR: When stacking, the predictions of individual models (e.g., regression, random forest, XGBoost….etc) are used as features for the final model.
Jim aka “The grocer” because I stack and bag (Bootstrap Aggregate) so much.
I would be happy to see these models in initial stages:
- Linear Regression, Ridge, Lasso, Elastic Net
- Decision Trees and Random Forrest
But models are least important for me, more important is framework. I would start with simple/standard framework and extend it based on user feedback.
The exciting feature for me is saving model predictions as a custom formula. Then you could do averaging by yourself in a ranking system or even using optimiser.
Thank you Pitmaster. I totally agree.
FWIW here is s k-fold cross-validation (witth a 3 year embargo using the easy to trade universe)
Addendum: So here is what someone new to this ACTUALLY NEEDS TO KNOW: It runs fast even on a laptop and only has 2 hyper parameters to adjust. Which could be done with a grid-seach and could take 15 minutes to look at every reasonable hyper parameter. Then you are done. Full stop. Do something else. Machine learning can make things easier.
Disclaimer. Just one model to look at with cross-validation. Maybe something else does better than elastic net for you. I would only suggest that Pitmaster has a good idea when suggesting the idea of possibly adding an elastic net regression to a cross-validation study.
Jim