Seminal paper cementing AI to the top spot for developing quantitative strategies

Dear All,

This is it! The paper that everyone is quoting for AI based strategies. It is the new benchmark. It’s incredibly complete with many empirical output reports. It must have taken thousands of hours to do (getting a PhD is getting harder and harder).
Empirical Asset Pricing via Machine Learning.pdf (1.1 MB)
Empirical Asset Pricing via Machine Learning Appendix.pdf (570.4 KB)
The paper is also found here

With our impending AI release (‘beta’ before year’s end for sure) it’s time to start a dedicated forum category and kick off discussions. Some key highlights from the paper

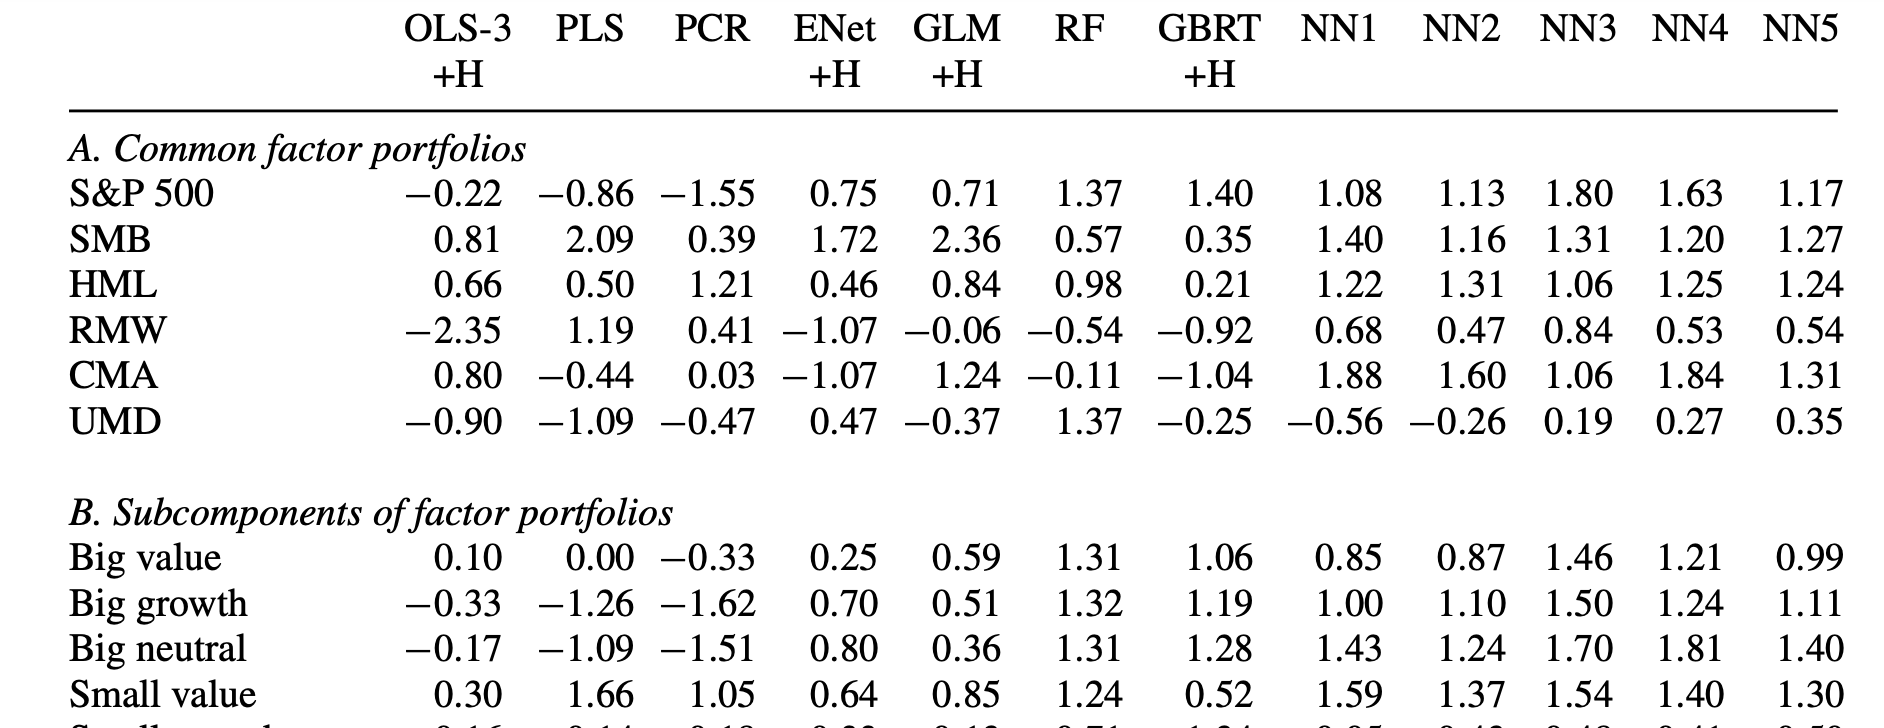
  • Top features (a.k.a. predictors , covariates, characteristics, factors) were technical , with top one being the 1mo reversal [1]
  • 8 macro series are used. Not clear yet their affect
  • Neural Nets came out on top with only 3 layers (in other words should not be too computationally intensive)
  • Massive historical dataset (60Y) comes at a price: only annual factors are used with a severe lag (6months+)

One key question raised by this paper is the following: did the technical factors come out on top because of the severe handicaps imposed on the fundamentals (annuals only and 6mo lag) ? Will the P123 shorter history, but less laggy fundamentals, be better overall ?

We are still digesting this paper and modifying our AI implementation accordingly. We should be able to offer all the models they use (NN, random forest, extra tress, etc). We’ll see about other innovations introduced like the use of predictive R2, tuning approach, how features are ranked, performance evaluations (1.8), etc.

In the study 94 features are used; we should be able to recreate most of them. Most require reading additional papers to come up with the formula. Perhaps the P123 community can help? There is always is our Factor Import, but we want to make use of that as very last resort. In other words we want to add missing factors natively if we have the data to create them or approximate them.

That’s all for now. I will pin this post on the new AI category and look for past AI discussion to move here. Please feel free to point them out.

Cheers!


  1. the 1Mo return is a reversal factor since it’s inversely proportional as you can see from Figure 7 ↩︎

1 Like

Marco,

Thank you.

I would like say the what we do now is already pretty similar to machine learning.

As it is P123 is a reinforcement learning platform.

Reinforcement learning can be loosely divided into 1) policy methods and 2) value based methods. But generally both will be used.

So far P123 has been focused on developing policies. A simple policy example is: "rebalance each week so that I start the week with the 25 highest ranked stocks.

Notice that a value for the return is each stock is never calculated for this policy. But this policy is tested and retested until the best policy is found in trial and error (each trial being called a backtest). This is reinforcement learning. Generally there is some human involvement when developing policies at P123 (but that can be minimized with outside programs).

Adding machine learning to reinforcement learning is just coming at this problem with a more value based approach. Machine learning will predict an expected return for each stock and one might then sort the expected returns—picking the stocks that have the highest expected returns.

Anyway, adding machine learning is just a way of adding value based analysis to what it is already being done at P123: reinforcement learning.

A natural thing to do IMHO. Thank you for looking at the best ways to do that at P123.

Best.

Jim

Isn’t there a bit more that? Top of my list is

  1. ML systems are non linear
  2. You can throw the kitchen sink at the problem, the model will sort out the importance.

Marco,

The 2 things you mention are definitely true of many (or most) of the machine learning methods mentioned in the paper, I think. As a specific example, boosting is clearly not linear. Boosting gives you a method of finding feature importances and it also automatically uses the most important features for each step in the algorithm.

There are linear methods mentioned in the paper too, I believe . Principle component regression for example. This is usually linear although one could use some non-linear methods for this like kernel regression or polynomial regression. For this method (linear or not), regularization will allow you to “throw the kitchen sink at the problem and the model will sort the importance.” At least to a large degree.

So yes, I agree completely.

My point was only that people should be pretty comfortable with this. We have debated on the forum whether what P123 does with machines or servers in another state is machine learning or not. Those who say that what we do now is not machine learning do have a point.

But what we do now at P123 is reinforcement learning pure and simple by any definition of the term.

You are simply adding some (very good) value based methods to what people are already doing, I think. And many of those methods have the advantages you mention without a doubt.

TL;DR. I agree completely…

Jim

Marco,

Thank you again for this paper. I assume it is being read at P123 in the context of what P123 will be making available as AI.

You said: " You can throw the kitchen sink at the problem, the model will sort out the importance."

This is only true in the paper because of the particular method of using training, validation and testing subsamples. From the paper:

" The first, or “training,” subsample is used to estimate the model subject to a specific set of tuning parameter values.

The second, or “validation,” sample is used for tuning the hyperparameters. We construct forecasts for data points in the validation sample based on the estimated model from the training sample. Next, we calculate the objective function based on forecast errors from the validation sample, and iteratively search for hyperparameters that optimize the validation objective (at each step reestimating the model from the training data subject to the prevailing hyperparameter values).

Tuning parameters are chosen from the validation sample taking into account estimated parameters, but the parameters are estimated from the training data alone. The idea of validation is to simulate an out-of-sample test of the model. Hyperparameter tuning amounts to searching for a degree of model complexity that tends to produce reliable out-of-sample performance. The validation sample fits are of course not truly out of sample, because they are used for tuning, which is in turn an input to the estimation. Thus, the third, or “testing,” subsample, which is used for neither estimation nor tuning, is truly out of sample and thus is used to evaluate a method’s predictive performance."

Without this AI at P123 will be just a better way to overfit more than is already being done. It is done in a particular (time ordered) way in the paper because of the time-series nature of stock data—to avoid “data leakage.”

Sometimes this is ignored in machine learning discussions because it is so basic. It is taught in the first few weeks in the freshman year and nothing is done ever again—even at the graduate level—without it. The authors of this paper, however, know how important this is and about the difficulties of doing this correctly with stock data. They did not ignore it.

This is more important than non-linearity or anything else in the paper (if you want to do it right).

It is like assuming there will be air when you are training someone in cross-country running. Not discussed perhaps, but only because it is so basic. It needs to be central to whatever P123 does with AI.

Jim

1 Like

Yes, very interesting. Like I said at the beginning, this paper took a while to write. I don’t think it says anywhere how many times they retrained for each model, does it?

In any case this should be doable with some tweaks. Of course they have 60 years of data to play around (not necessarily a great thing). So they can have large training, tuning, and oos periods. With 20 years you need to be a bit more careful selecting periods.

Marco,

As far as how many times they retrained that is the cool thing about AI. Ideally the answer would be infinite (with the fastest computers).

With a MacBook and Python I would do a “GridSearch” for boosting. Here is the code for one of my GridSearches:

parameters = {‘loss’:(‘deviance’,‘exponential’),‘learning_rate’:[.0005,.001,.003,.005,.01,.015,.02,.03,.04,.05,.06],‘n_estimators’:[55,65,75, 100,125,150, 175,200,225,250], ‘max_depth’: [1,2,3, 4, 5, 6, 7, 8, 9]}

For me on that day (with a MacBook) it was 990 iterations (running in a few minutes). So its runs through all combinations of each of those parameters.

That is not to mention the core “Gradient Descent” algorithm that is basically an automated optimization system.

Ideally we would have a quantum computer and the answer would be “we ran through every possibility.” But my guess is the authors had pretty good computers and the answer is “at lot of training (retraining)” and they might not be able to give you a number themselves.

The thing is we already see overfitting with manual optimization at P123. Overfitting when not being able to run through nearly infinite automated iterations.

They control that by training on one set but in some way stopping (eg. early stopping algorithms) or regularizing to get the best results on a different set of data that is not being trained (the validation set).

Then at the end there is the test set which is true out-of-sample where no training or validation was ever done.

There are people at P123 who might disagree in which case we can ignore the authors and start reinventing the wheel with endless debates on the forum. Debates that the Kaggle group will certainly ignore—along the the entire P123 site as a machine learning site. That is not to say they might not use the API and run their own programs with cross-validation.

This does indeed eat up the data. I think 20 years is probably enough for this method, however.

But there are other methods that are better for 20 years of data. The walk-forward method is probably the best but will eat up computer resources.

De Prado like the “purge and embargo method.”

De Prado cautions against the K-fold method (recommending the purge and embargo method to remedy the problems. I have found that he has a point. K-fold has its problems but it is better than allowing pure unchecked overfitting with a computer running unlimited iterations.

Your AI programmer will understand K-fold (if not you should fire her immediately). By now she should be aware of the problems that stock data provides (basically the data is not stationary).

I would recommend kind of a “block walk-forward.” E.g. Train validate 5 years, test the sixth year. Then Train/validate 6 years and test the seventh. Then train/validate 7 years and test the eighth.

With a fast computer your would “walk-forward” each week (not each year).

This ends up being a real backtest of the algorithm that one would be using in real life if possible. One would update the algorithm with an online system like this (each week if possible or perhaps every year).

Maybe your AI specialist may want to discuss his different plans for validation and testing on the forum. Maybe he already has a good plan for this.

She should already have some ideas and be set to implement something in this regard or be willing to explain how she expects people to do this manually.

Jim

Few minutes? How big was the dataset ?

Marco,

Recently I have been using a 203 x 16 array mostly of technical data to specifically answer your question. This was with Sklearn’s boosting program which is different than XGBoost.

But XGBoost is specifically designed to be fast and to use parallel processors which takes advantage of special programing for boosting.

I have done over a millions rows (using the returns of all the stocks in the universe each week) on a MacBook pro with no GPU. I never really timed it but I think it could take 20 minutes perhaps.

Random forests are particularly good at using parallel processors. How fast it will run depends solely on how many parallel processors you can bring to the task. I have 4 threads available and it is actually pretty fast.

Neural nets are sped up through matrix multiplication which is ideal for GPUs but that too is doable on an old MacBook pro (with no GPU)…

I wish I had a better answer (and better computer).

Jim

Where I can find information about P123’s beta AI feature? Using the P123 API?

Gs3

Marco,

So, I get that one could read the paper and think one should move to boosting and neural-nets. I used to be that way myself. Also, I would recommend that you continue to incorporate those methods to the extent that your hardware (computing power) allows.

But please take a moment to look at the advantages of partial least squares (PLS) with me. I think you will find that it is worth your time.

  1. when you step back and look (maybe squint a little bit :thinking:) at PLS and what Yuval does you will find them pretty similar. I argue that Yuval is essentially doing a manual version of PLS. Of course, it is possible that Yuval self-identifies as being a discretionary trader or whatever. But I do mean this as the highest-of-complements with regard to his final automated quantitative-investing product(s) and natural core understanding of math and statistics that led him to his method indepentently.

  2. PLS DOES BETTER THAN ANY OTHER METHOD for small-cap value with regard to out-of-sample predictive R^2. There are a lot of people investing in Small-cap value at P123. Small value at the bottom of this table from the paper:

  1. I think you will find PLS is the method with the least computational requirements. P123 is known for its backtest speeds and those speeds may not need to be any slower or have much greater computational requirements. THIS IS FOR A COMPLETE STATE-OF-THE-ART AI IMPLEMENTATION WITH NO COMPROMISES. Why:

a) linear models are less prone to overfitting. Some of that train, validate and test becomes less necessary.

b) linear models are very quick—not needing GPUs etc

c) because of (a) and (b) you could probably go to a train/test method (skipping validation) in a true walk-forward backtest. And it will be fast or at least fast enough to implement it.

d) And P123 could continue to implement this with an online algorithm for the live port. Meaning the machine learning method is retrained before each rebalance.

YOU MAY NOT KNOW IT YET BUT THE COMBINATION OF (c) and (d) IS HUGE!!!

And it bears repeating: PLS was the best method for small-cap value in the paper you referenced.

TL;DR. If you explore this further you may find PLS is the method that provides the best returns for small-cap value stocks, and that it is less computationally intensive–allowing for the best implementation (walk-forward backtesting with online learning). ANYTHING THAT I FORGOT TO CONSIDER?

Jim

I’m confirming that we will have both PLS and OLS with penalization. Not sure about automated brute force tuning initially; you will need to create permutations by hand. The k-fold is very interesting to “multiply” whatever data one has.

Not sure what you are saying re. block forward. In your example, do you end up with three trained models? And then are you saying that a 3 year Portfolio backtest uses a different model each year?

Another major goal of this “AI” project is that it’s usable by non data scientists. Some features will be part of the AI factor subsystem, others like the block forward simulation, can be constructed (if I understood correctly)

PS: perhaps we should rename the project “ML Factor”? Can’t really call PLS “AI”.

Marco,

Thank you. Interesting how caught up in definitions we are. I like to bypass all of that and say everything we do with a remote server in Chicago falls under the umbrella of reinforcement learning (perhaps some of the learning is done manually and by a human). But a serious question since you bought it up: what parts of P123’s project are AI (as opposed to machine learning)? Not PLS I guess, but boosting is AI? Maybe just neural-nets meet the definition of AI? I am okay with any definition. Its just a definition and I want to use anything that works whatever it is called. I promise not to debate this but I truly find it interesting how much people like to parse the definitions and even find it important sometimes (not that you do necessarily).

Definitions aside, very cool that you have PLS and cannot wait to try it!!!

I agree that K-fold is interesting and de Prado’s modification of it with an “embargo” is not really a difficult improvement to make programing-wise. Definitely worth looking into I think.

I think some sort of cross-validation is absolutely necessary. Walk-forward is just one way to do it. K-fold (with or without embargo) is another.

The way the paper does it is a third way. They did say it was important. You called it a “seminal” paper. I think they have a point regarding the need for cross-validation and some of their comments about the advantage of the way they did it might be accurate.

Walk-forward may be worth discussing with your AI ( or machine learning) specialist. You might continue to look at walk-forward even if my explanation is not so good. It is one way to make 20 years of data be more than enough and it has other advantages. Better than say K-fold or the way the paper your referenced did it? Sometimes IMHO.

Most simple example with a fast computer and monthly rebalance. Train 5 years of data and predict the next month. Then train on 5 years and one month of data and predict the following month. Then train 5 years and 2 months of data and predict the next month……until now where you are training on all 20 years of data and predicting the next month that has not happened yet in a live port.

So you are backtesting what you would have done each month with the data you had at the time. It gives 15 years of predictions (pretty good). There is absolutely no possibility of look-ahead bias (unless there is a problem with the data provider in that regard).

Presently at P123 we train on all of the data then run a backtest that includes the data we just used to train the model with–along with future data that never would have been available at the time.

We can do better than that, I hope, Walk-forward is just one way we could do better.

Jim

Well I was quoting our Stanford Professor friend who forwarded it me. But a quick google search shows a bona fide explosion in research using AI in trading strategies. Incredible actually. 916 citations in just two years. Piotroski’s FSCORE has 1545 citations in 20 years.

3 small remarks:

  1. Providing users with modelling methods like this, in addition to rank methods, is incredibly helpful to source alpha. P123 has been late to the game. We should allow models to be used for both forecasting stock returns AND volatility. If P123 is willing, any explanatory variable should be able to be modeled (macro, factors, factor spreads, etc.).

  2. Least squares falls under “AI”. There are many OLS learners available. Most of them are focused on selecting the factors that minimize squared deviations. Neural nets provide more permutations to maximize fit. This maximizes the chances to overfit. LS by design make it harder to overfit. Jim is 100% correct with his remarks re it’s power. Deep learning in fact does just this: combines models for maximum effectiveness. This was the research breakthrough that made AI a household name.

  3. Boosting, bagging etc. are all proven in their effectiveness. But again, these are double edged swords. Great if you are right in your research. God awful if you are wrong. Optimization techniques maximize research errors, by definition.

No idea how you are implementing this Marco et al but be sure to allow users to conduct alot of out of sample testing (training vs testing sampling). Linear, stratified, etc.

Thanks Jim!

Really excellent paper. I’ve read the paper carefully and looked to apply it to some of the p123 solutions as well as my own applied machine learning knowledge and tools. Specifically, I thought about how I could create a random forest model using Dataminer and my excel random forest plugin to predict excess forward returns. The initial results, conducted only over a limited sample period (admittedly unusual) of 2020. My next step will be to test this model over a rolling/walkforward period.
I pulled the simple rank (1-100 scale) of each of the Portfolio123 core ranking systems (combo, value, growth, etc.) for each stock in the Russell 1000, along with trailing 12 month return. I used forward 12 month return as the predictor variable (the value we are trying to predict with the random forest).
Of course, we want to split the data into training and testing segments. To do this, I split the data by market cap, training the model on the bottom 500 stocks in the Russell 2000, and testing the data on the top half (e.g. the S&P 500). I hope this gives a robust out of sample test to conduct, but I am open to any feedback on increasing robustness or reducing biases – am I missing any here?
The random forest then uses its sorting technique to use the factor scores to predict forward returns. Through tuning, I found that a 3-layer tree works best, consistent with the results of the Kelly, Gu, Xiu paper.
In practice, you would then rank the full list of stocks from high to low by expected return, and form a portfolio of the top 10, 20%.
Backtesting this through 2020 gives a total return of 124%. All in all, more fantastic data from P123 to explore, and the initial results have been positive. Feedback is welcome and appreciated in advance.


RFchart2
RFchart3
Rfchart4

1 Like

Chambers,

Nice!

I would only note your use or planned-use of a “rolling/walkforward” method. As I noted above, I think maybe P123 might be able to implement this for some machine learning methods.

That would be impressive to say the least. But whether P123 can implement this or not: very nice!!!

As you know, walkforward is the ultimate test of what would have happened had you been using this strategy in the past with no lookahead bias whatsoever.

For those who like to use the full train, validate and test method one can train and validate up until a certain date to find the best model. After selecting the best model with the validation subsample one can test the final holdout sample. A true out-of-sample test of what you will be doing going forward.

I think P123 has enough data to do that—especially if one uses a relatively short rolling window is willing to start the training with a short window.

Like you, I think walkforward is a good way to go. And I also find a rolling window often works best.

Jim

Just a quick update here as I continue the research. Unfortunately the strong results i saw initially were at least partially due to lookahead bias. This is because i originally set up the model to make predictions on Jan 1, 2020, and trained the model on the full year returns, then used those forward returns to forecast the rest of the sample for 2020. So I would not have had access to that information if I was using this model in real time.

I went ahead and re-trained the model on the full 2020 data set, and used it to forecast 2021 returns. Unfortunately at this point the model broke down and OOS R^2 was insignificant. However, this only used one set of data points (as of Jan 2020) - so i think by building a rolling/walkforward test that incorporates more data points for each stock, it will increase the robustness.

All in all, the first test i think shows that returns are based significantly on factor exposures, but that forecasting which factors will work best in any particular time period is extremely challenging.

I’ve also noticed in the literature that RF models tend to work better on shorter forecast periods, so I will investigate that, and also that predictive power is better in forecasting positive/negative returns, rather than the absolute value, so i will also look into that.

Finally, i want to use a random forest model to sort and select factors for inclusion in a ranking system. This will take a bit more time for me to work through since it requires structuring the data in a different way.

Chambers,

You probably saw this but the paper limits the splits for random forests more than you are used to, I suspect.

I have not done a lot with random frorests on P123 stock data recently but when I did I used something similar to the authors in this regard, Specifically, I had a pretty large minimum leaf size (around 500 or 600). Obviously, I determined the leaf size “hyperparameter” using cross-validation.

I suspect this sounds crazy to you as generally we do not have minimum leaf size for random forest, in part because they are supposed to be so good at preventing overfitting. Ultimately we tend to use one or maybe five as a minimum leaf size. Five is the default for skelarn, I think.

I developed the concerpt of “resolution.” By that I mean what kind of detail (or resolution) do you want to resolve in your data or are even capable of resolving with your algorithm?

If you have weekly data and and are just hoping you can find the top 5 stocks each week that turns out to be a “resolution” of 5 x 52 x 20 or 5,200 stocks!!! That is all the resolution you need to become a bazillionaire. And in practice your resolution will not be even that good. That is all of the detail you need to see and you probably are not capable of "resolving " any further detail without a quantum computer or something.

Sure it would be great if your program was so omnipresent it could predict what stock would be the best one in the next 20 years but that is not necessary. Nor is possible in the real world.

TL;DR. The authors may have a point about limiting the splits or leaf size with a random forest or with boosting. At least put a few “crazy high” leaf sizes (or small split numbers) into your GridSearch to start with.

Jim