Edit: This is not simple by any means. Several factors interact in complex ways:
- Skew tends to increase with volatility
- Momentum effects are often stronger in highly volatile assets
- Selection bias (P123 strategies tend to pick "winners" among volatile stocks)
- Rebalancing frequency interacts with all of these effects
The simulation below explores just one piece of this puzzle.
I've always suspected volatility harvesting plays a role in our strategy returns, but quantifying it has been challenging. Let's call this "Jrinne's Conjecture" - that frequent rebalancing of volatile stocks creates additional returns beyond what you'd expect from buy-and-hold.
The theoretical basis comes from Shannon's Demon, where rebalancing between just two volatile assets can generate profits even when the individual assets go nowhere. Our P123 strategies often deal with 15+ stocks, many highly volatile, and we rebalance frequently. This suggests we might be benefiting from a multi-asset version of Shannon's effect.
To test this, I worked with Claude to simulate a 15-stock portfolio where:
- Stocks have different volatilities (20% to 60% annually)
- Expected returns scale with volatility (5% to 15% annually)
- Weekly rebalancing back to equal weights
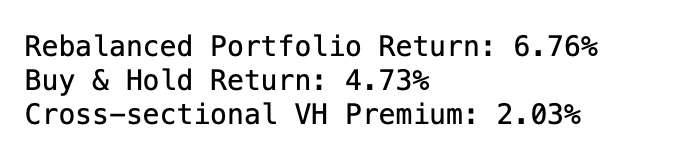
The simulation shows a ~2% annual premium from rebalancing alone (above a 4.73% for buy and hold for this simulation). This is conservative since:
- Real stock volatilities are often higher
- Returns often have positive skew
While not definitive proof, the simulation supports the conjecture that volatility harvesting contributes to our returns through systematic rebalancing.
The output:
More about Shannon's Demon from Fortune's Formula: The Untold Story of the Scientific Betting System That Beat the Casinos and Wall Street:
'To make this clear: Imagine you start with $1,000, $500 in stock and $500 in cash. Suppose the stock halves in price the first day. (It’s a really volatile stock.) This gives you a $750 portfolio with $250 in stock and $500 in cash. That is now lopsided in favor of cash. You rebalance by withdrawing $125 from the cash account to buy stock. This leaves you with a newly balanced mix of $375 in stock and $375 cash. Now repeat. The next day, let’s say the stock doubles in price. The $375 in stock jumps to $750. With the $375 in the cash account, you have $1,125. This time you sell some stock, ending up with $562.50 each in stock and cash. Look at what Shannon’s scheme has achieved so far. After a dramatic plunge, the stock’s price is back to where it began. A buy-and-hold investor would have no profit at all. Shannon’s investor has made $125."
Poundstone, William. Fortune's Formula: The Untold Story of the Scientific Betting System That Beat the Casinos and Wall Street (pp. 202-203). Farrar, Straus and Giroux. Kindle Edition.
The code used:
import pandas as pd

def simulate_cross_sectional_vh(n_stocks=15, periods=52, vol_range=(0.2, 0.6), return_range=(0.05, 0.15)):
    """
    Simulate the effect of cross-sectional volatility harvesting with stocks of different volatilities
    """
    # Create stocks with different volatilities and expected returns
    # Assuming higher volatility stocks have higher returns (risk-return relationship)
    volatilities = np.linspace(vol_range[0], vol_range[1], n_stocks)
    expected_returns = np.linspace(return_range[0], return_range[1], n_stocks)

    # Simulate weekly returns for each stock
    returns_list = []
    for i in range(n_stocks):
        weekly_vol = volatilities[i] / np.sqrt(52)
        weekly_ret = expected_returns[i] / 52
        stock_returns = np.random.normal(weekly_ret, weekly_vol, periods)
        returns_list.append(stock_returns)

    returns_matrix = np.array(returns_list).T

    # Compare strategies
    def run_strategy(returns, rebalance=True):
        portfolio_value = 1.0
        weights = np.ones(n_stocks) / n_stocks
        values = []

        for week_returns in returns:
            # Update portfolio value
            portfolio_value *= (1 + np.sum(weights * week_returns))

            # Update weights based on returns
            weights = weights * (1 + week_returns)
            weights = weights / np.sum(weights)

            # Rebalance if enabled
            if rebalance:
                weights = np.ones(n_stocks) / n_stocks

            values.append(portfolio_value)

        return values

    # Run both strategies
    rebalanced_values = run_strategy(returns_matrix, rebalance=True)
    buy_hold_values = run_strategy(returns_matrix, rebalance=False)

    # Calculate metrics
    rebalanced_return = (rebalanced_values[-1] - 1) * 100
    buy_hold_return = (buy_hold_values[-1] - 1) * 100

    # Calculate contribution from different volatility levels
    vol_contribution = {}
    for i in range(n_stocks):
        vol = volatilities[i]
        ret = expected_returns[i]
        vol_contribution[f'Stock {i+1}'] = {
            'Volatility': vol,
            'Expected Return': ret,
            'Actual Return': np.mean(returns_matrix[:, i]) * 52 * 100
        }

    results = {
        'Rebalanced Return (%)': rebalanced_return,
        'Buy & Hold Return (%)': buy_hold_return,
        'Cross-sectional VH Premium (%)': rebalanced_return - buy_hold_return,
        'Stock Contributions': pd.DataFrame(vol_contribution).T
    }

    return results

# Run simulation
np.random.seed(42)  # For reproducibility
results = simulate_cross_sectional_vh(
    n_stocks=15,
    periods=52,
    vol_range=(0.2, 0.6),  # 20% to 60% annual volatility
    return_range=(0.05, 0.15)  # 5% to 15% annual expected return
)

print("\nCross-sectional Volatility Harvesting Analysis")
print("=" * 50)
print(f"\nRebalanced Portfolio Return: {results['Rebalanced Return (%)']:.2f}%")
print(f"Buy & Hold Return: {results['Buy & Hold Return (%)']:.2f}%")
print(f"Cross-sectional VH Premium: {results['Cross-sectional VH Premium (%)']:.2f}%")

print("\nContribution by Stock Volatility Level:")
print(results['Stock Contributions'].round(3))

# Calculate additional metrics
stock_data = results['Stock Contributions']
correlation = np.corrcoef(stock_data['Volatility'], stock_data['Actual Return'])[0,1]
print(f"\nCorrelation between Volatility and Return: {correlation:.3f}")

# Calculate rebalancing profit opportunities
vol_spread = stock_data['Volatility'].max() - stock_data['Volatility'].min()
print(f"Volatility Spread (High - Low): {vol_spread:.3f}")