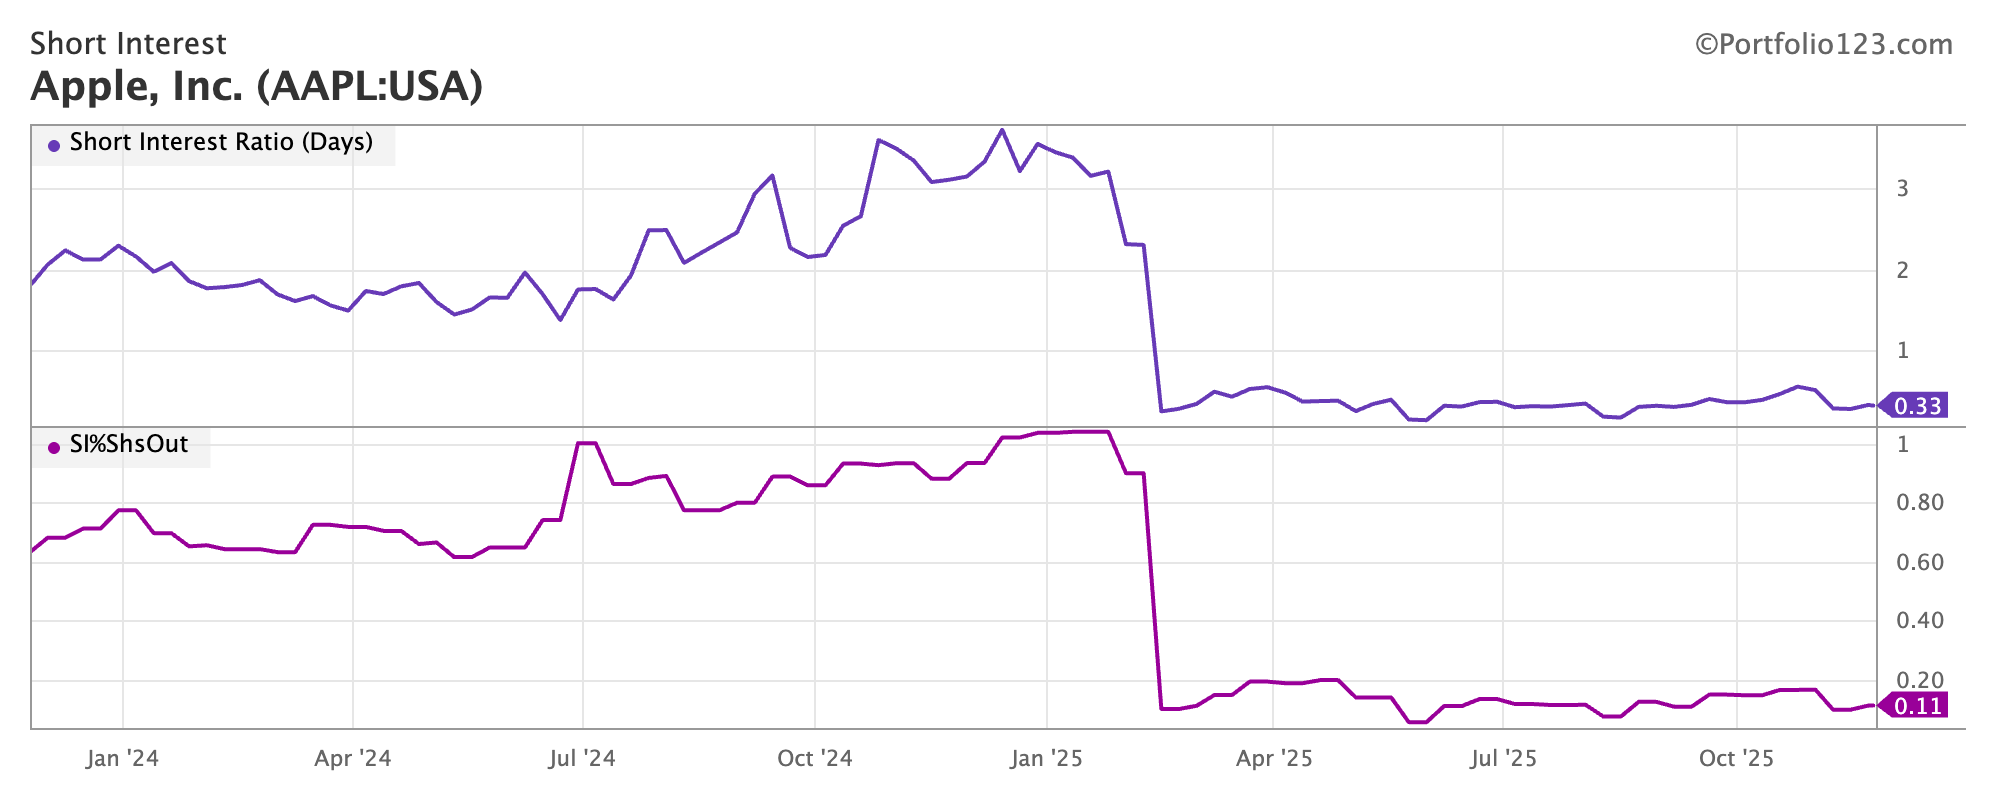
All the stocks I have checked have a big drop in their short interest Ratio and SI%Shout in February 2025. This is obviously not correct. Any issue with the data?
2 Likes
Walmart, Colgate, Nvidia are the same
In more small caps like hims gamestop it seems normal…amazon, meta , jpm, nvidia..and other big caps have a huge decline in this factor in February as stated…
Our data vendor has changed its source for short-interest data, with the new feed beginning at the end of February 2025. When we asked about examples showing significant differences versus the prior data, they explained that this was expected because the figures are now sourced directly from the securities-lending market rather than from exchange-reported numbers. We are evaluating options to improve the user experience.
3 Likes
From my point of view is an important factor to be normalized for obvious reasons…waiting for your final solution
1 Like
Can’t we just backfill with the new feed?
1 Like
It s an important issue to be solved some of AI USA systems I detected used this factor like one of the most importants…and of course most part of traditional systems should use it to avoid some trash. Maybe @judgetrade @yuvaltaylor @moral_es @pitmaster @AlgoMan @Doney1000 @SZ @Jrinne and rest of users of course… did you notice that and what s your point?
1 Like
Does this mean we can have daily data now? I will have to look more into this to opine on the quality, but does this enable daily data? That would be a positive vs the monthly one. The securities lending market they refer to is probably daily data.
well…the main problem is that we are testing with one kind of data and validating it OOS with other…nonsense
2 Likes
Yes, I assume P123 will have to change the past data to match the new source or procure the old source elsewhere. My point is this new data is likely daily data which I think would help live performance. If a system uses absolute values (in its rules) for the metric based purely on a backtest it could be an issue with the new values, but relative ranking might just be fine. Definitely would be good to compare and make sure though.
1 Like
Short Interest up to 2007 in portfolio123 appears to be a monthly reported value, then twice a month until the source recently changed to daily. I previously had some limited success using it in comparisons due to what I thought was delayed reporting, but going forward with daily values might improve the data significance. Were the monthly and twice monthly values for SICM totals by ticker for the entire reporting period or a last reported day outstanding value? The examples shown by henribu seem to indicate the old values were reporting period totals while the values going forward will apparently be daily reported totals. So will values such as SIRatio require us to modify the usage based on its date? This could have a very significant impact on some analyses. I assume daily reported short interest will be net interest outstanding rather than new positions taken.
1 Like
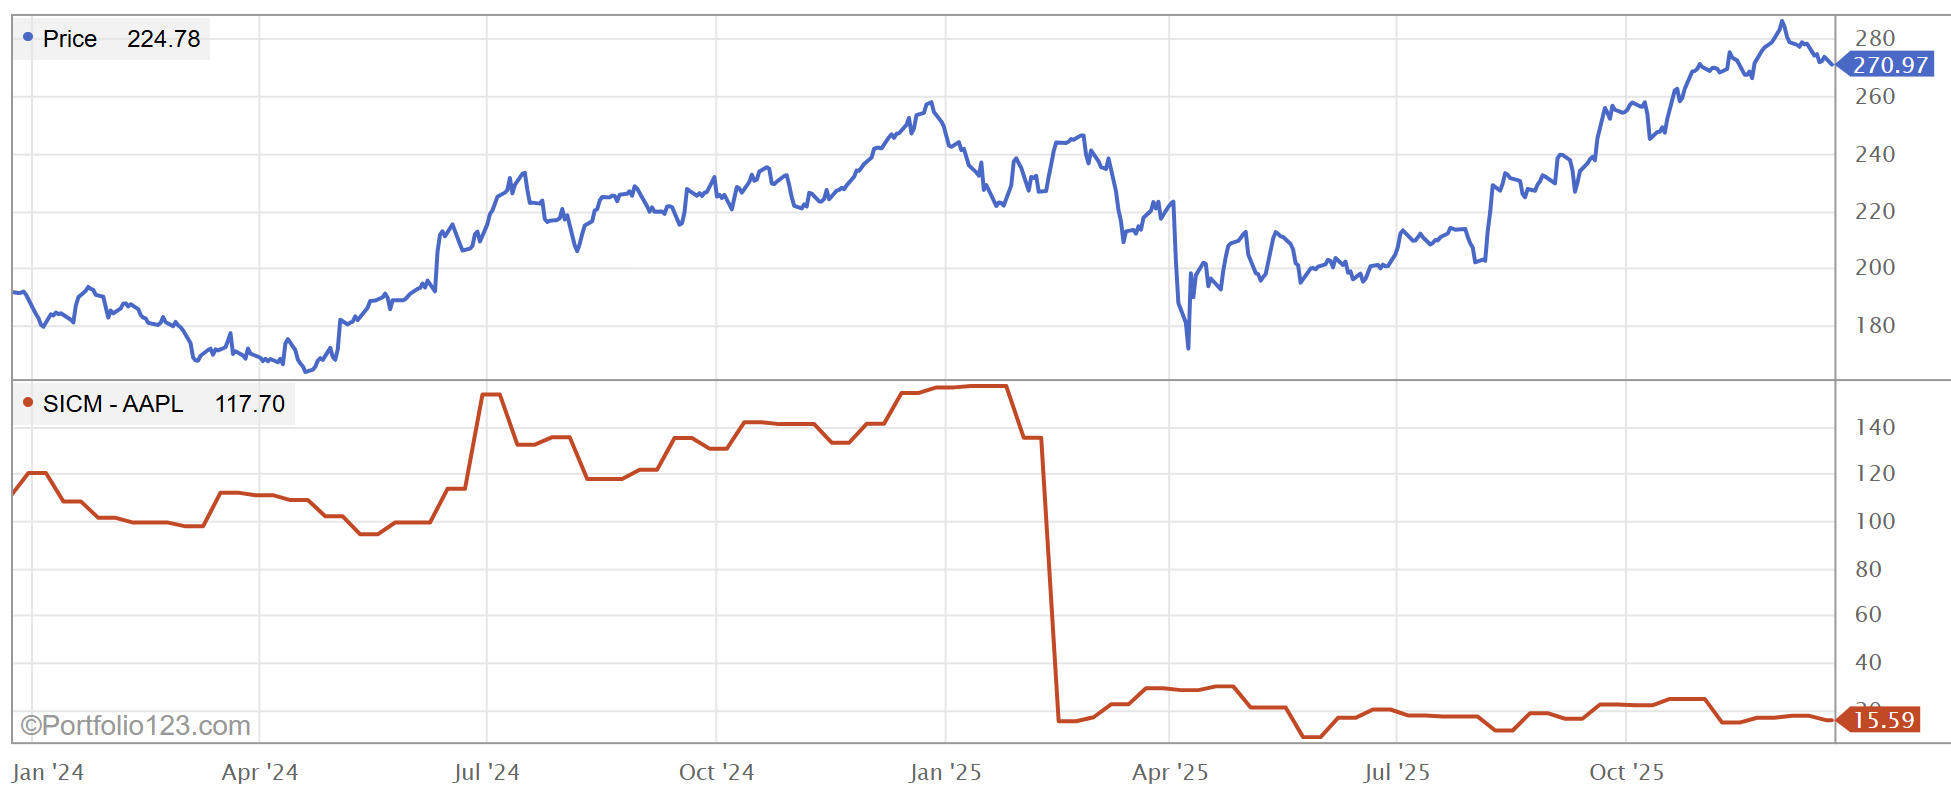
FYI, I found out about the issue by running an aggregate series on S&P 500 median short interest as a % of market cap.
Ranking systems are fine as long as the jump to the new datastream happens on the same day for all stocks. However, you have an issue if you look at short interest rate of change, or any aggregate time series. Ideally, we want to backfill with the new datastream.
1 Like
Any thoughts, solution on that @marco ? Thanks
never used it.
The unique way for now to manage or try to fix this is to avoid fix rules with limits and maybe use a Frank() where all the supposed glitch in this data will move in the same direction at least…but its not elegant or polished…
1 Like
Any update about this feature and possible data glitch ? ..I am quite sure that there are plenty of quant investors using it in factor models and in AI models? We should take a look at it...
Sorry for the delay in addressing this.
As you know, our vendor changed the way they collect the data back in Feb 2025, and it's completely different than FINRA's short interest data. See AAPL below.
It is not clear is why they did this. FINRA data is free. After all, it's mission is to create a level playing field: "FINRA's mission is to protect investors and safeguard the integrity of our vibrant capital markets to ensure that everyone can invest with confidence". Some clues maybe come from one of FINRA's terms of use:
Data can be redistributed provided there's no charge for the FINRA data.
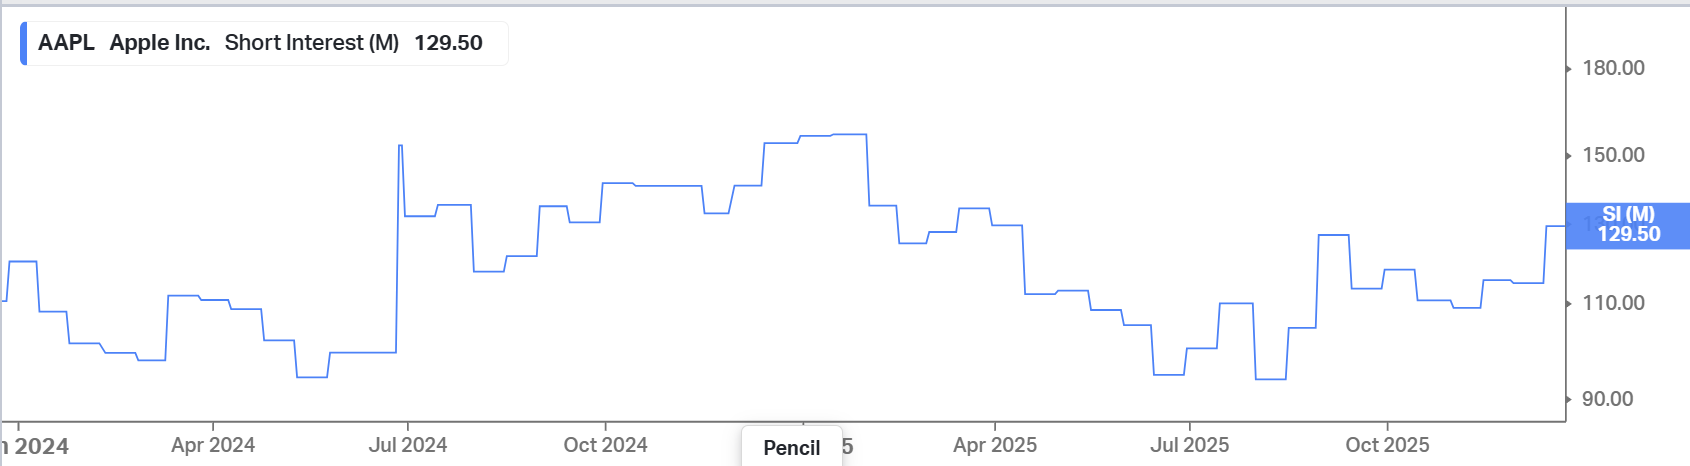
So the "no Charge" might explain the reason. This also explains why you can chart the data on sites like finviz and koyfin w/o a paying subscription. Well, we can do that too! We will add a short interest stock page that shows you the data for free.
I downloaded the data from FINRA quite easily and everything looks good. Should not take too long to re-instate the consistent, short interest data that we had before. Sorry for taking so long to address this.
AAPL 2Y short interest on P123
Koyfin FINRA Data
3 Likes
The recent Short Interest data change reveals a critical difference in impact between model types:
- For traditional linear/factor models , a data shift may cause slow drift or be "masked" within the model's weighted average.
- For AI/ML ensemble models (LightGBM, XGBoost, etc.) , the impact is immediate and catastrophic . These models learn complex, non-linear rules from the precise statistical properties of the training data. A fundamental change to a factor corrupts the model's internal logic at its root, leading to systematically wrong predictions, not just noise.
Given that a single corrupted feature can collapse an entire AI strategy, a crucial question arises: Are there any controls or safeguards by Portfolio123 to assure that the core factor data offered is not dynamically changed or contains glitches, as happened with Short Interest?
For advanced quantitative research, the integrity and immutability of the historical data series is non-negotiable, if not we are wasting our time and should focus maybe in traditional factor models...
Hi Everyone,
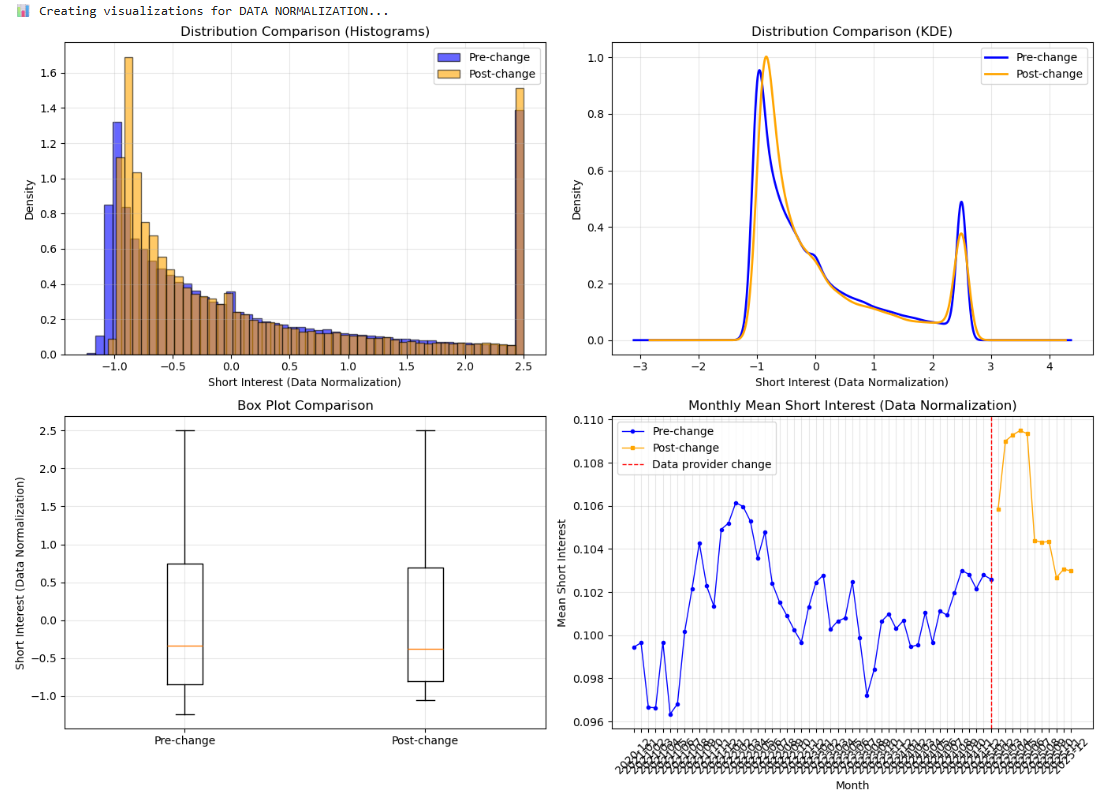
I was running some test about Short Interest feature to see if the data was broken after Feb-25 vs before Feb-25. I was thinking that maybe after normalized the data before and after with z-score it could keep same parameters (cause the overall statistic it should be pretty the same, only changing period, time or some kind of form of collecting data).
I will put some of my findings after being working in some statistics in Python (with the feature normalized with dataset and date). With dataset I expected to find more similarities cause the way that it's computed. I took data from 2020 until last week and split it before and after the change. The summarize is good enough:
 FINAL COMPARISON: FIT DATASET vs DATA NORMALIZATION
 SUMMARY OF BOTH ANALYSES:
-
FIT DATASET NORMALIZATION (previous file):
• Mean difference: -0.001078 (0.0931% of std dev)
• Cohen's d: -0.000911 → TRIVIAL effect size
• Distributions: Nearly identical visually
• Statistical tests: 'Significant' due to large sample size
• Practical impact: NEGLIGIBLE for AI models -
DATA NORMALIZATION (current file):
• Mean difference: +0.004574 (0.3958% of std dev)
• Cohen's d: +0.003978 → TRIVIAL effect size
• Distributions: Slightly more difference in lower quantiles
• Statistical tests: 'Significant' due to large sample size
• Practical impact: NEGLIGIBLE for AI models
======================================================================
 KEY INSIGHTS:
-
BOTH NORMALIZATION METHODS ARE STABLE:
 Neither shows meaningful change after February 2025
Data provider change didn't break either version
Both maintain statistical properties -
DIFFERENCES BETWEEN NORMALIZATION METHODS:
• Data normalization shows slightly larger differences (0.40% vs 0.09% of std dev)
• But both are still TRIVIAL in practical terms
• Your choice depends on which normalization works better in your model -
FOR YOUR AI MODEL:
You can use EITHER normalization method with confidence
The February 2025 data change is NOT a concern
Model performance should be stable across the change -
RECOMMENDATION:
• If your model was built with FIT DATASET normalization → keep using it
• If your model was built with DATA normalization → keep using it
• Don't switch normalization methods mid-stream
• Monitor OOS performance as usual
======================================================================
 FINAL CONCLUSION:
Your hard work on the model is SAFE with either normalization!
The data provider change had NEGLIGIBLE impact.
You can be CONFIDENT in your simulations and backtests.
![]() COMPARISON TABLE:
COMPARISON TABLE:
Metric Fit Dataset Normalization Data Normalization
Total records 518,215 518,212
Pre-change records 434,745 434,740
Post-change records 83,470 83,472
Pre-change mean 0.103598 0.101390
Post-change mean 0.102520 0.105964
Mean difference -0.001078 +0.004574
Mean diff (% of std dev) 0.0931% 0.3958%
Cohen's d (effect size) -0.000911 (TRIVIAL) +0.003978 (TRIVIAL)
Distribution overlap 100.00% 100.00%
Practical impact on AI model NEGLIGIBLE NEGLIGIBLE
And some graph:
2 Likes
And if the data is available daily that is not just ok/compatible but better no? I think this data used to take much longer to refresh so the daily availability is great