Based on that, wouldn’t you have sold out in Dec16, Jun17, twice in Oct17, and earlier in January as well?
Very interesting insight but would be interested to see how/if you implement it on P123 and how it has backtested.
Thank you everyone for sharing your insights.
Christopher, thank you for your post. It would really be interesting to see how this backtests.
No, I didn’t say that weekly closes above the 2-SD range on 20-week Bollinger Bands should trigger a Sell signal. Notice that each time the market closed slightly above the band there was a slight pullback that ensued. Larger breaks above the bands (as occurred three weeks ago) result in large reversals downward. An investor could place a stop on positions that are affected by a development like this in the weekly Bollinger Band indicator. That’s what I did with my stocks when I saw that price had gone way over-extended the week of January 22 and my positions were closed with a profit before things got ugly.
Imagine Bollinger Bands functioning like a hollow, soft-rubber tube. Prices are bouncing around inside it (from bottom to top and back) and we’re seeing a cross-section of that. The farther the tube/band stretches in one direction, the farther will be the rebound in the opposite direction. Therefore, an investor should realize that the optimum entry point is at the bottom of the bands, which in my chart was last shown in November 2016. Notice that was also when the “3-week RSI” and “Percent of stocks above the 50-day moving average (!GT50SPX)” were both in oversold territory (below 30).
Note that condition is occurring now, as I write this (February 9, 2018), so a good entry point will occur as soon as those weekly indicators rise back above the 30-threshold. Because the weekly price of the index is now below the 20-week moving average, it’s possible that prices will continue going downward. Although with RSI already oversold, that’s less likely. Without these kinds of signals to tell an investor when conditions are overbought and oversold and where good entry and exit points occur, the average investor is just playing he ‘buy and hope’ game. That’s not a great investment strategy.
Chris
P.S. - Because prices did not reach the bottom of the Bollinger bands and stretch the tube downward, don’t expect a big sky shot upward. Prices only moved to the middle of the ‘tube,’ around the 20-week moving average. As expensive as stocks are, we may see a fairly sideways market for most of this year (before deep selloff in the late-third or early-fourth quarters, 2018)
Hi everyone,
I guess these indicators you are using are all customized using other economic and market timing indicators, would you tell me how you do this?
Thanks,
I got mine from searching through old posts.
Hi,
I actually wanted to say how do you create the chart in p123?
Thanks
Chris’ charts were created in StockCharts.com, a very powerful charting tool, although sometimes a little confusing.
I make mine by abusing the Custom Series tool.
Walter
The (SPY-Cash) Hi-Lo index will go to cash on Monday.
https://imarketsignals.com/2015/avoiding-stock-market-crashes-with-the-hi-lo-index-of-the-sp500/
https://www.portfolio123.com/mvnforum/viewthread_thread,9071#47989
I thought you used 100-d EMA with this timer?
I use the 40 bar SMA of (new quarterly highs - new quarterly lows)% of the S&P500.
This simple timer switching between VTI and BND shows annualized return of 10% with max D/D = -15%.
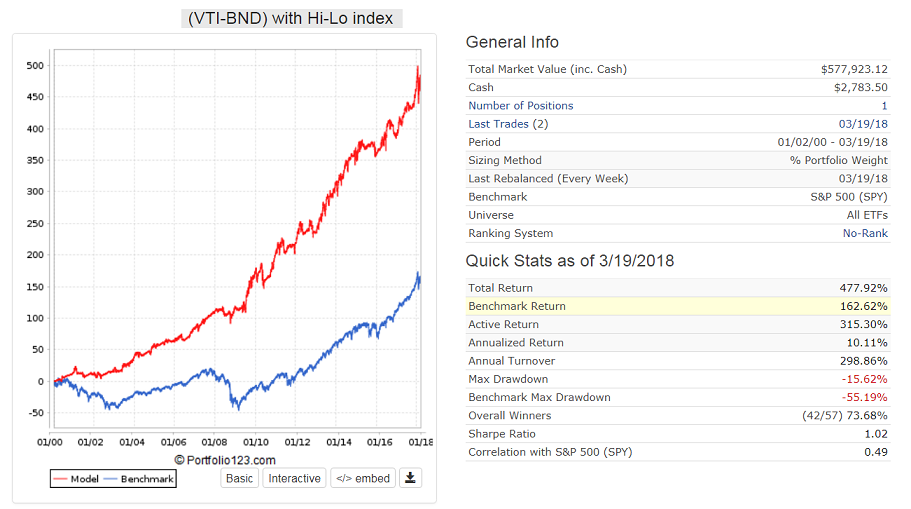
There is something wrong with your model. Turnover is much too high. I use a trigger of 5%. Here is the buy rule:
Eval(SMA(40,0,GetSeries(“Quart Hi-Lo”))>= 5 ,ticker(“VTI”),ticker(“BND”))
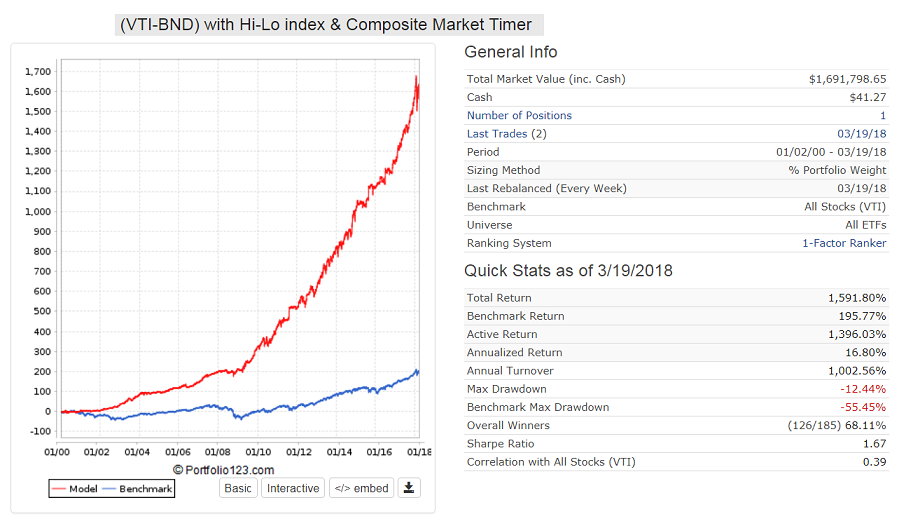
Adding the Composite Market Timer improves returns to almost 17%.
Eval($comp>=50 ,ticker(“VTI”),ticker(“BND”)) | Eval(SMA(40,0,GetSeries(“Quart Hi-Lo”))>= 5 ,ticker(“VTI”),ticker(“BND”))
I must have an error in my custom series then:
(UnivCnt(“hi(0)>=highval(60)”) - univcnt(“low(0)<=lowval(60)”))
invalue!! so after your trading system, we’re entering a bearish scenario when closing today this week under the 20 week moving average, is that right?
Here is the rule I use expressed in percent, -9.4% as of yesterday:
100*(UnivCnt(“Hi(0)=Highest(#High,63,0)”) - UnivCnt(“Low(0)=Lowest(#Low,63,0)”))/UnivCnt(“close(0)>0”)
anybody abandoned this market yet?
I’m also interested to hear from Chris what TA might have told us about the recent drop.
no, still long 130%, up 1,5% for the year, DD 4,5% from high. This market feels like 2015, corrections yes, but no bear market.
USA Bull Case (can change fast)
Earnings trending up like hell, have not seen a market, where earnings trended up and market went to bear market.
still record low interest rates
investor sentiment (again) terrible
USA good demograhics
slowdown yes, but no recession forecast by ECRI
small caps showing good rel. strength
still above 200ma (right sitting on it)
tech revolution (tech, biotech, AI, Energy revolution, converging of industries)
Best Regards (my last bull case is from beginning of 2016!!!)
Andreas