Single factor performance using alpha and volume based slippage

I am curious what other folks think about looking at factor rank performance using different metrics than just returns and fixed slippage. Such as variable slippage and alpha.

I recently downloaded ranking data for use with ML algorithms and I wanted to check the individual factor performance to make sure I was not feeding the ML model junk. Since I am using alpha - slippage as my training target for ML I wanted to see how the factor ranks performed with this target. The results were surprising to me in that slippage inverted a number of my factors. That being said I am applying slippage every week which is an exaggeration as I am not turning over the portfolio every week. Do other folks have experience with looking at factor performance with slippage or alpha? If so do you think the effects I am seeing are because I am applying too much slippage?

Edit: this is all for a universe with the following rules:
image

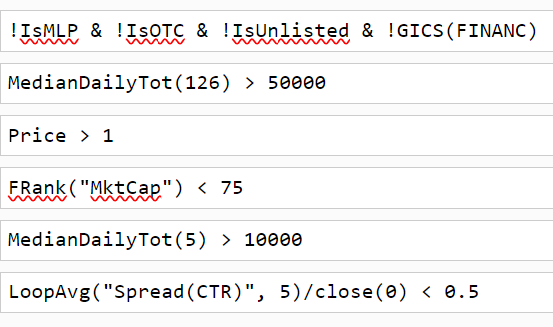
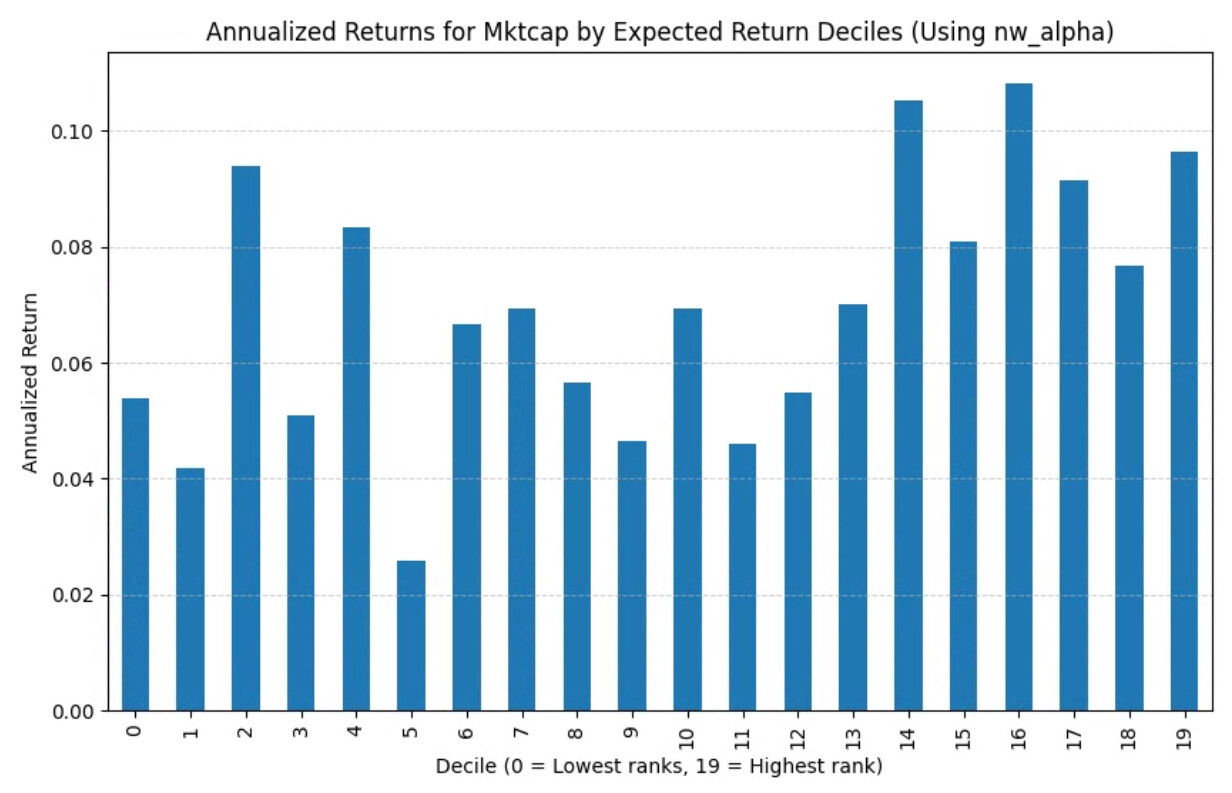
For example if you look at Market Cap with just annualized returns and say 20 buckets the relationship looks something like this for a universe similar to the Prussel 2000: please ignore the chart title saying using NW_alpha. I forgot to update my code, it is using next week gains.

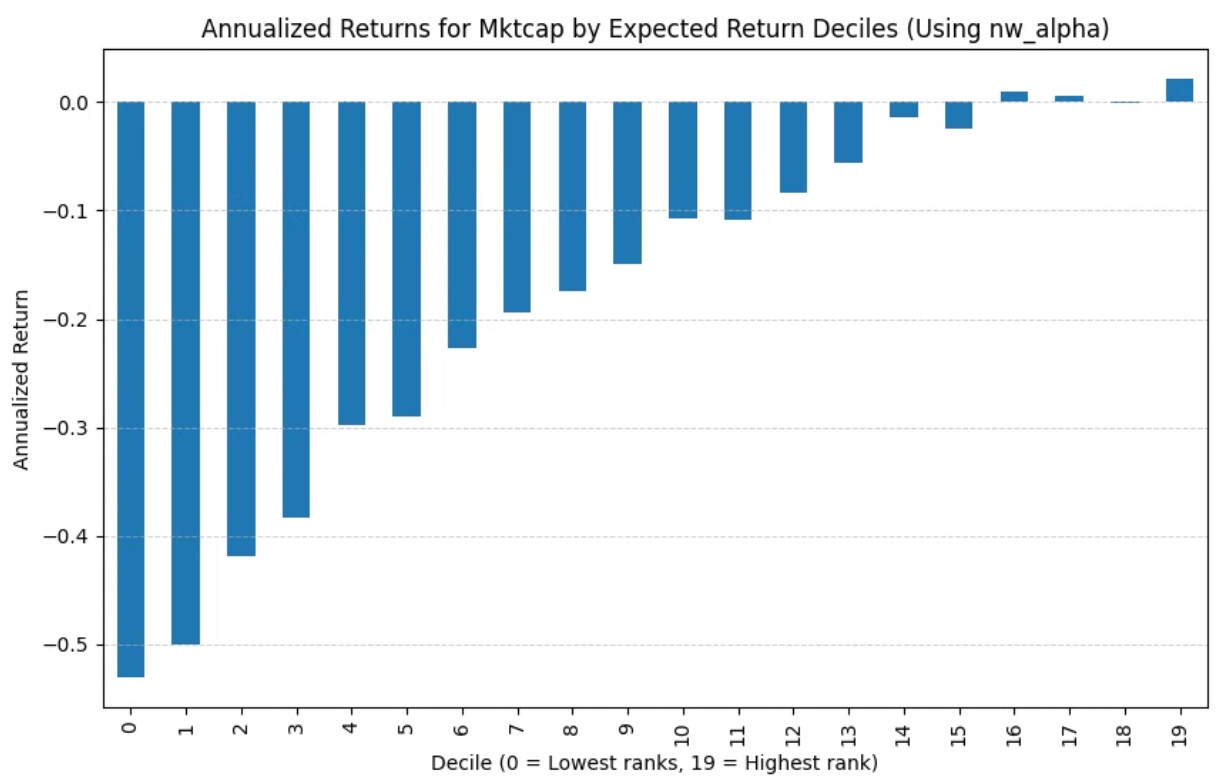
However, if I add in volume based slippage (see the transaction costs blog by Yuval for how I calculated the slippage) I get a much stronger trend:

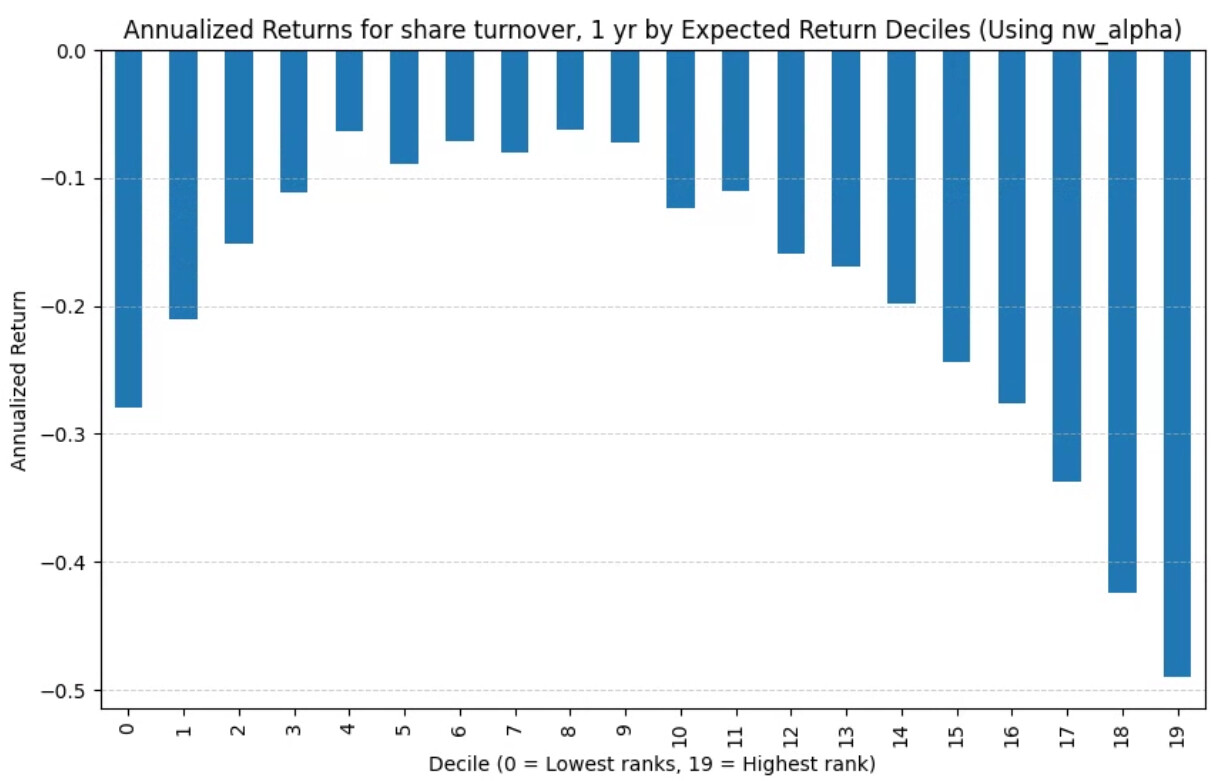
A more significant change is 1 year share turnover: using next week gains without slippage

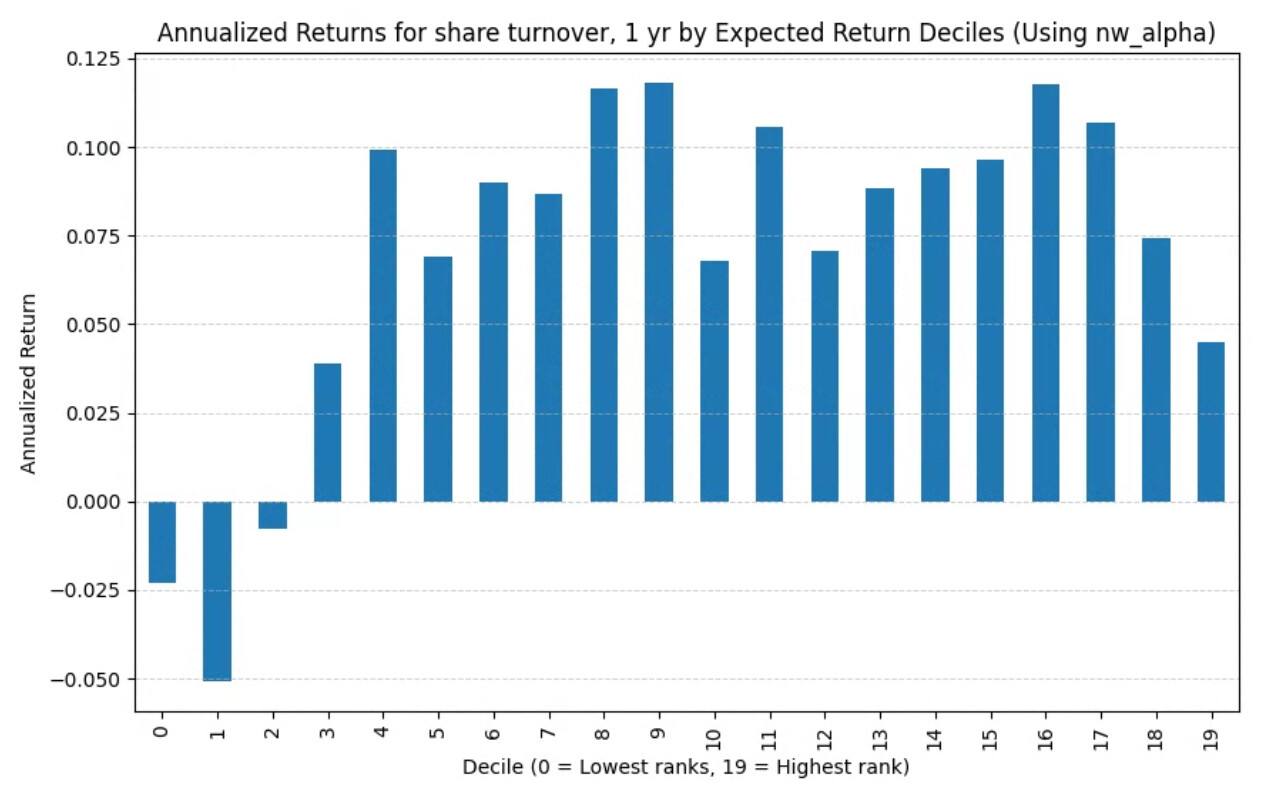
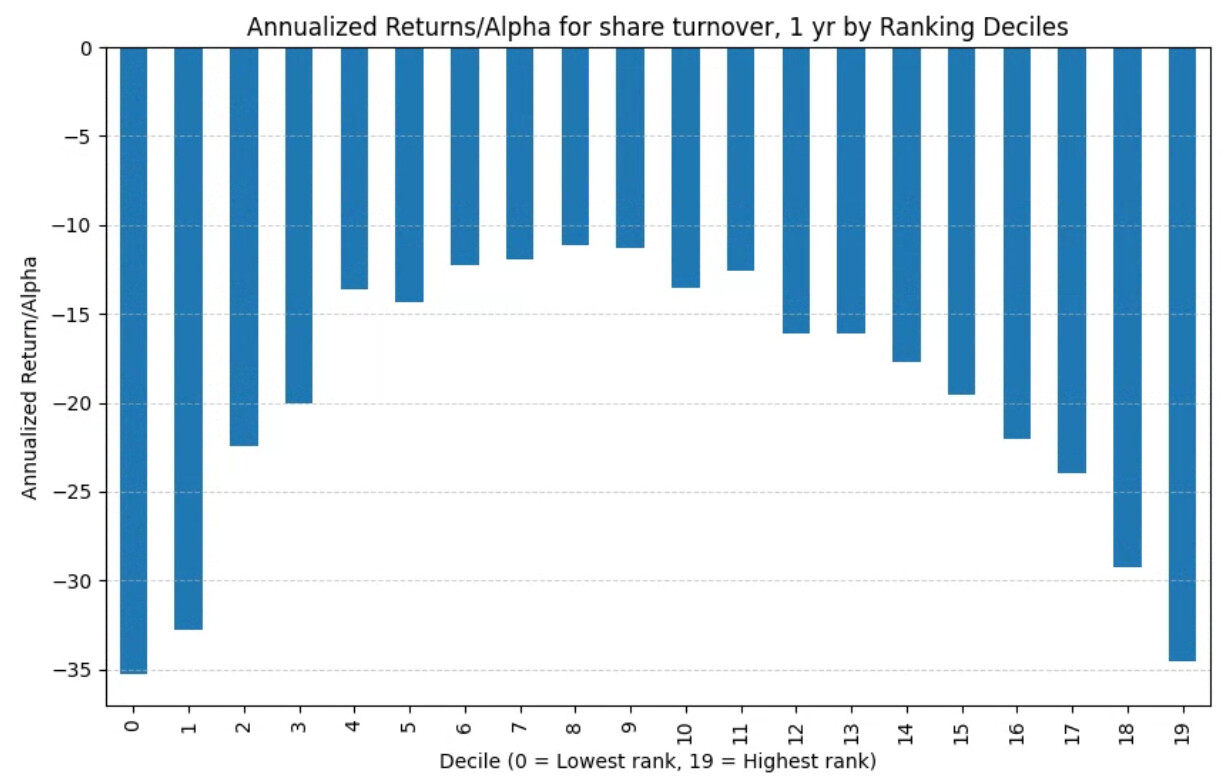
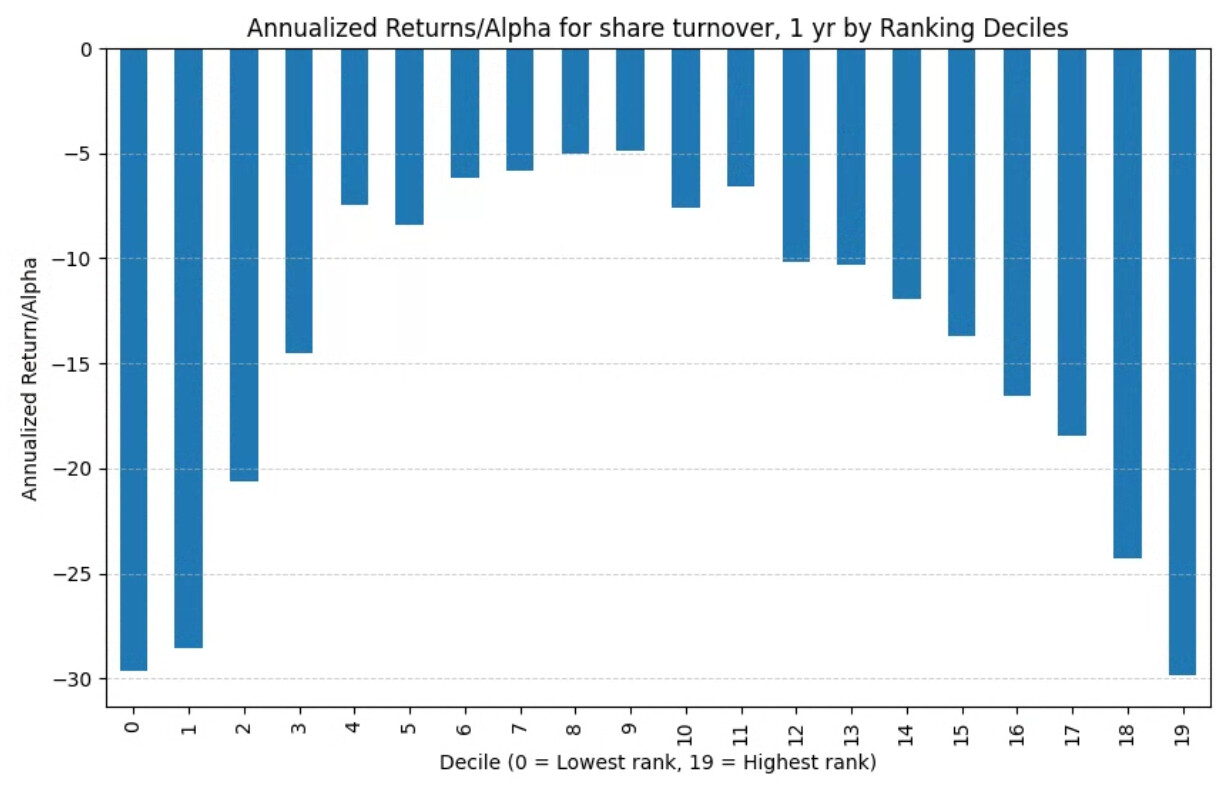
Using alpha without slippage (sorry my chart titles are wrong): note the trend is almost gone

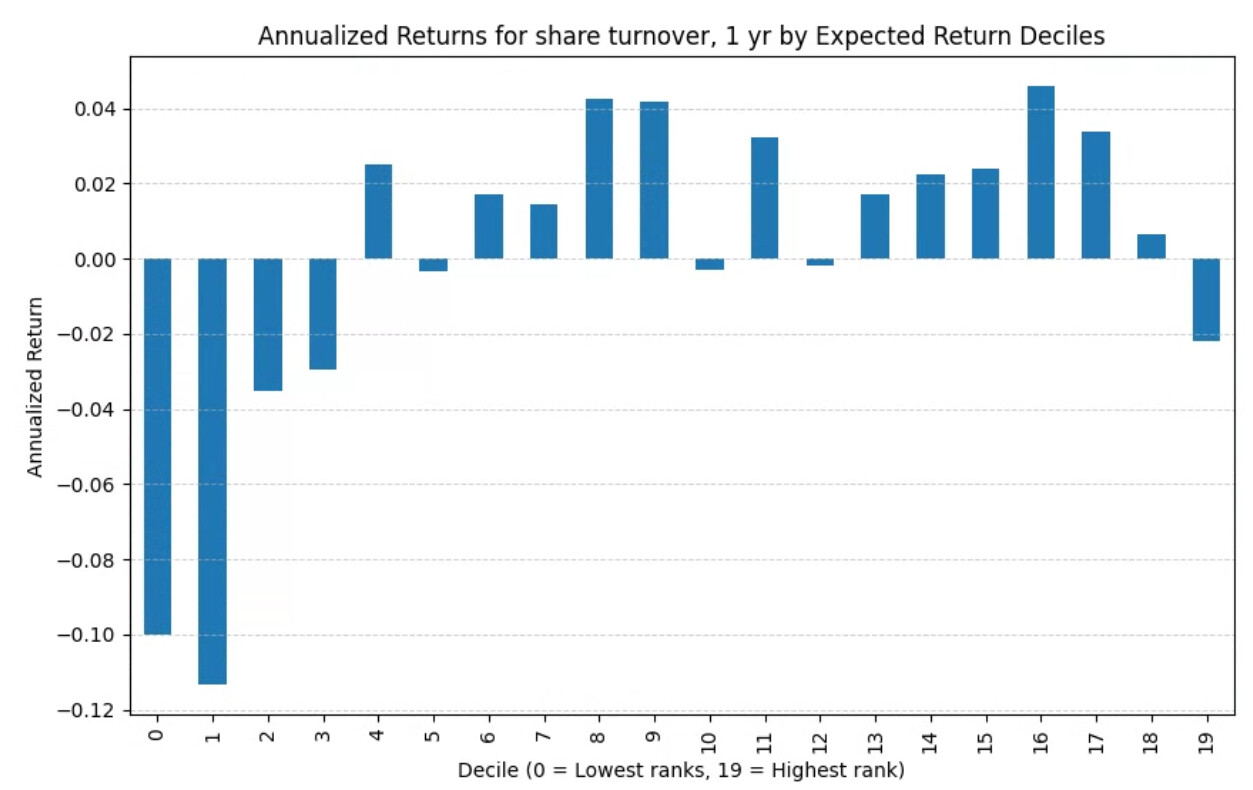
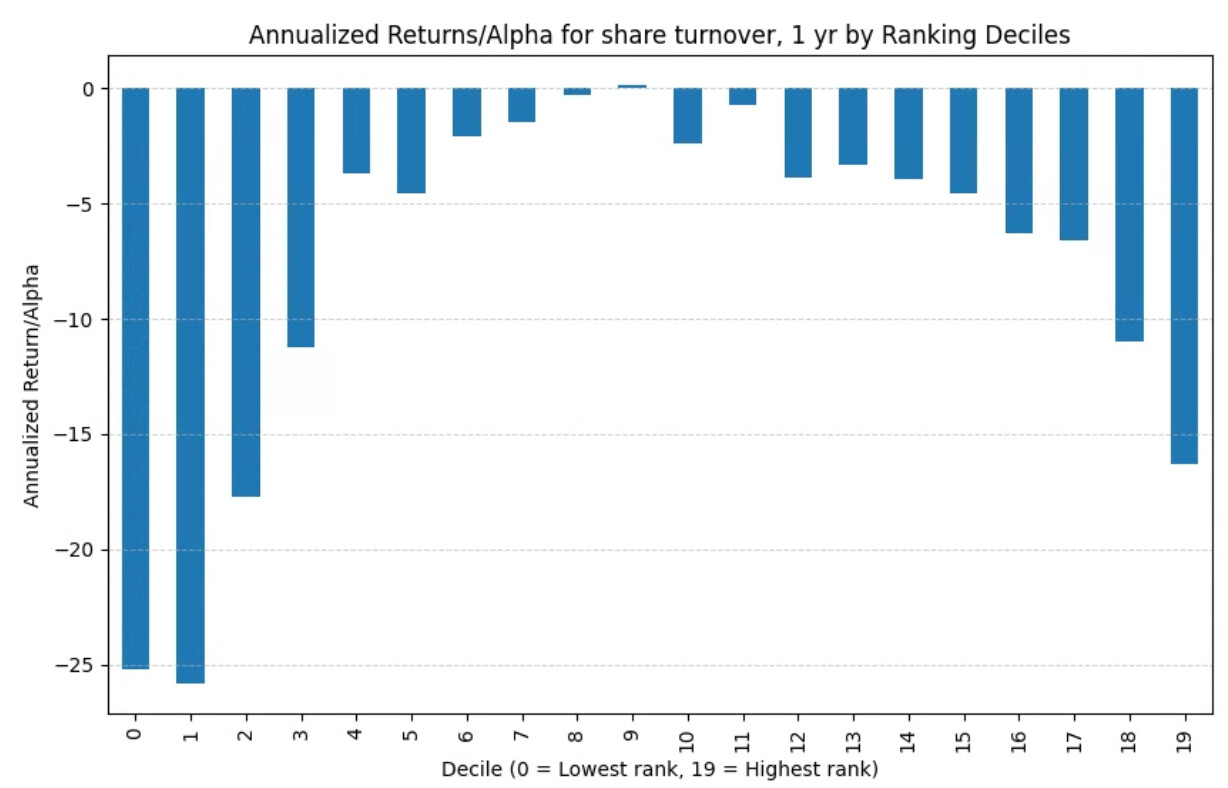
With slippage (next week gains, but alpha looks similar): the trend reverses for the most part

Jonpaul,

I am not sure that I have much that can help on this. How do you calculate nw_alpha?

Jim

That is what I would expect, since slippage costs are going to be significantly higher for stocks with low market cap or low share turnover. That will definitely affect your returns if you’re rebalancing weekly. One advantage of the way you’re doing things is that you can set a slippage cost for every stock; those of us who rely only on Portfolio123’s engines can’t see this, so your graphic illustration is eye-opening.

I’ve been pushing for this for some time but to no avail. We need to be studying alpha and be able to toggle between seeing costless trading (ie comission and slippage) and trading with costs. Little doubt your findings are incorrect.

I do not know why P123 has not incorporated this given the results of the designer models and their old “core” systems. Seems like a reasonable thing to do.

Thanks for the post. Much needed.

NW_alpha is the next week’s % change for the stock minus the average % change for the universe. That being said my chart titles are wrong. I’ll try to clean up the post when I am back at my computer!

Since this effect is so pronounced with weekly rebalance I think I’ll try to not reapply slippage every week and see what it looks like.

Also as we all know multi factor ranking systems are rarely pure addition of factors and they usually build on each other. So it’s difficult to know if an inverted curve for the single factor means it would have a negative effect on the entire system. I think market cap is a great example of that.

If there was an indication of how often stocks moves between buckets in in the Rank Performance test, we would get an idea of stable a factor would be in strategy.

For a sim you can get average days held. Maybe take the trading cost and multiply it by 5/(the average days held), or 5/(trading days) is probably better. On average over a large sample, it might be close enough.

I forgot to mention in my original post (I will edit in a minute) that this is for a universe with the following rules:
image

I still want to look at actual turnover in the different ranking buckets, but I did not have time today. However, I did divide slippage by two and got the results as below. Still seeing the same trend.

Here is how I am calculating slippage:

  • Assume a port of $200k and 20 stocks
  • Volume slippage = square root($10k/average dollar volume per day last week)*.025
  • Spread slippage = (last week average spread %)/3 (I am dividing by 3 assuming that you can get a little bit better than bid or ask. This is not conservative, but should help make the effect a little less dominant)
  • Total slippage = volume slippage + spread slippage

Now slippage should apply on buy and sell and I am applying it once per week. So if I assume a holding period of 1 month then the slippage per week should be 1/2 of the single time slippage. So if buy and sell slippage is 2X slippage, then if I divide 1X slippage it should be about the same as 4 weeks of holding. Probably not exactly due to compounding, but much closer.

Annualized alpha with slippage:

Annualized gains with slippage:

Remove the volume slippage: note removing the spread slippage looks similar. Not surprising since we would expect low volume stocks to have larger spreads.

Also here is P123 plot for no slippage on the same universe. Just as reference in case my code is full of it: It is a bit different than my plot above, but it is fairly similar…

So I think it gets complex.

It does seem that for the most part the slippage just moves everything down. More or less affects each bucket equally.

But also, the factor is no good to begin with? Pretty flat really. Only the poor performance in the first few buckets gives it a positive slope.

Might have a negative, small and/or non-significant Spearman’s rank correlation coefficient if you happen to use that metric.

But if you had a factor with a good positive slope it would be difficult to determine whether a single factor with a small weight was moving a ticker in and out of a sim with the small weight it has (moving in and out causing increased trading costs). And whether the trading cost is outweighed by the benefit of the factor—especially with any interactions XGBoost might detect.

So you might have to use a factor in a full ranking system then remove it (maybe with recursive factor elimination) and see if the results improve or worsen. With slippage calculated in the target. Would that be a way you could tell with reasonable confidence?

Not sure that helps. Not sure what I would end up doing. Just some thoughts.

Jim

Jim,
I think you are right that it is mostly just shifting down the curve. But, alpha/slippage do seem to exaggerate the high and low ends of the rank such that the max is shifted.

I agree looking at factors in isolation is not very useful, and factor removal is a good solution to determine its value. However, I would like a way to determine if a factor needs a transformation to be useful. Lets say we have a factor like what I have above where the optimal single factor value is somewhere in the middle of the rank. I can make this single factor more useful by applying a transformation such as a polynomial fit such that the middle ranks are now the highest rank. However, if I look at it in a multi-ranking system then I cannot see this relationship. Granted it may not have the same relationship in a multi-factor ranking system…

So yes at the end of the day I agree it gets complex. Maybe ML can untangle it, but I have not succeeded in getting a ML system to consistently outperform the equivalent ranking system, so I am still thinking about linear system solutions.

Good point. I have tried Polynomial regressions (and Kernel regressions) myself.

Definitely XGBoost works for non-linear things like this factor also. I was wondering if you were doing that after I wrote it and considering editing what I said out.

Cool.

What you’ve done by assigning slippage to every stock makes this particular process a lot easier.

I realized long ago that market cap lower better was not sophisticated enough of a factor to do all that I wanted it to do. Stocks with market caps of about $100 million are actually harder to predict (partially because they often have no analyst coverage) and their transaction costs are enormous. Stocks with market caps of $2 billion are also very hard to predict because too many people are trying to predict them. The sweet spot is in between.

If slippage were calculated for every stock in a ranking system, like you’ve done, then coming up with a polynomial fit would be a cinch. As it is, I have to generate every bar in a decile ranking system separately in a screen by using FRank and applying the right slippage for each group of stocks. So you already have one leg up on us . . .

Do you limit your universe in your live strategies with:

mktcap > 100
mktcap < 2000

Jonpaul,

Thank you for sharing the above.

So calculating slippage for each stock should be trivial for anyone with a spreadsheet that has all of the proper columns. It could be done withiin the spreadsheet.

That along with calculating the excess returns relative to the universe should make for a nice target variable!!!

As an aside, this seems to be a feature that Yuval has wanted for a while and he has been unable to get it implemented. Almost all feature requests go unanswered at P123 even if you are on the staff in charge of product development, it seems. I have probably gotten more feature request implemented than anyone other than perhaps Yuval but I have had to be aggressive to even get anyone at P123 to understand my requests in the first place. It took a lot to get the API with just ranks for the purpose of machine learning as a feature. P123 was unaware that ranks are as good as raw fundamental for many machine learning algorithms. It was my idea and I make no apologies for posting until P123 understood. I think it will ultimately be their most profitable feature if they succeed in marketing the machine learning capabilities of P123 properly.

So here is my point with this: It is hard to imagine that the AI/ML will be fully complete when it is released. Will the cross-validation be perfect and suit everyone for example? A feature request will take years if it is ever even entertained. P123 needs to continue to put considerable emphasis on the API and DataMiner, I think. So people can implement their own feature ideas as Jonpaul has succeed in doing here.

Anyway, can you also share what your DataMiner code looks like with regard to downloading the data you use to calculate slippage?

I have some new API credits today that I want to use over the weekend.

Please, edit out of your code anything you do not want to share. Just volume, stock volatility etc if you feel comfortable sharing it. I can code some things pretty well but for DataMiner I prefer to just copy and paste.

Thank you in advance if you do feel comfortable sharing that.

BTW, the DataMiner and API could use a reference section similar to what is available for the screener as it gets expanded. Or maybe it is the same code and I just need to get familiar with DataMiner. But I burn API credits each time I experiment. I am back to square one today after not getting future returns right.

I think the API and DataMiner will get used a lot. Things like slippage for each stock can be done by most people now. And even more complex things can generally be done by anyone with ChatGPT’s help and a little patience. Anything P123 can do to make it more efficient and therefore more profitable for them in the end would be a win-win for everyone. Maybe even a price reduction to attract volume as this get more popular (or not as I do not see the numbers, I do not have any business degrees, and that is not my call).

Jim

Hey, I am not using DataMiner, but I am using the two following formulas that you can add to the additional formula section:

  • Spread 5 day average as a ratio to Friday’s close, you can multiply by 100 if you want a %: ‘LoopAvg(“Spread(CTR)”, 5)/close(0)’
    – note spread is closing spread according to the documentation
  • 5 day average dollar volume: ‘MedianDailyTot(5)’

A Friday only value may be better, or a look ahead value (not sure you can with spread), but this seems less prone to issues and should be more consistent.

1 Like

Perfect! And much appreciated.

No, I do not. I occasionally buy stocks outside those limits. Right now, for example, 7 out of the 47 stocks I’m holding have a market cap of less than $100M, though in the aggregate they make up only 3% of my portfolio. Sometimes they do well. PFIE was well under $100M when I bought it and it’s up 142%.

My ranking system (mktcap in range: 20 - 500mil) also predicted PFIE to buy. My best stock this year.

My experience with nano caps is that you can add a lot of value if you are a good trader - nano caps more often than large caps exhibits extreme mean reversion, you may want to reduce your position at good moment very quickly + manage explicit and implicit transaction costs wisely.

1 Like

I used to use MktCap>20mil but I read somewhere some stocks were getting delisted as the market cap is now greater than 50 million for some exchanges, so I now use greater than 50M, Also I have seen some exchange restrictions that price>$2 but tend to ignore that because a company can always reverse split there shares to increase price but I am concerned that stocks could get delisted due to low market cap - have any of you ran across profitable stocks that were delisted in the last year due to low market cap? But I agree there is a sweet spot as far as market cap and liquidity goes