The same?
Looks to me like the hedged port is worth about $295,000 more at the end of the simulation period.
I’d rather have the lower draw down, it keeps my morale up.
I guess a 66% draw down doesn’t matter if you rarely look at the results.
I don’t think this kind of result is possible long term. There must be some kind of a mistake. Maybe trying with with a simulated portfolio and adding a bigger slippage % would make it more realistic. Of course I am a newbie here, but not in the stock market.
I guess that all depends on what you consider long term. But I would caution everyone to be skeptical of in-sample simulation results.
The single displayed equity curve really represents a collection of equity curves with one being selected for display by the developer. It may have been before you joined, Bastringue, but there was a discussion about how to display in-sample and out-of-sample results for Smart Alpha models. P123 quite sensible decided to separate the two curves. The prior method of showing one continuous curve was a bit misleading as it implied some kind a continuity of results.
Simulation results are nice for discussion and that’s about it … one can’t invest in a simulation.
Best,
Walter
That’s reasonable when we’re talking about marketing optics.
Realistically, though, I feel more comfortable seeing the 66% drawdown because I know that’s more representative of probable reality if we have another global melt-down. What scares me is a simulation that looks designed to lull one into a false sense of security, a simulation that suggests the model is designed not on the basis of legitimate ideas but based on an effort to paint a pretty picture however unrealistic it may be. Lack of credibility scares the daylights out of me. I love it when somebody shows a 2008 drawdown of -66%, or even -80%. It means they have the you-know-what’s to facer what’s real and what’s real is that in a global meltdown, we’re all screwed, which by the way, is exactly what happened to p123 users in 2008 because the market timing techniques that defeated 2008 were invented after the fact.
As for morale during the crisis, nothing would damage it for me more than suffering when I thought, going in, that I’d be immune. If I know I’m vulnerable to a melt-down, then I’m paying attention when the news flow gets ominous and getting out or making a thoughtful decision to ride it out (the p123 members who took mega-drawdowns in 2008 were made whole and then some quickly afterward).
Yes, absolutely. That’s why I wanted to see the trading system and offered to give private feedback, an offer that was accepted.
Stocking only to what Kumar said openly and respecting the privacy of his work, I can tell you that I suggested changes which look like they were made. I can also tell you that the model was not filled with a collection of items from the curve-fitter’s standard palette (there really isn’t much serious I.P. in the 90%-alpha models because I already know what they’re putting in and how they’re juicing the results) but with legitimate factors including ideas that are outside my wheelhouse but legit nonetheless.
The challenge, here, is really in how to get feedback on a model without disclosing one’s secret sauce. You’re right; there’s not much that can be inferred from presentation of sim results. I have the advantage of knowing what’s under the hood; you don’t. There are three possible approaches:
-
Before R2G/SA, it was very commonplace of p123 for users to save all or a heck of a lot of their work with visibility set to public. That way, when feedback is sought it was easy for anybody so see the trading system. Fast forwarding to the present, it might be useful for everybody to give serious thought into the need for privacy. If you are investing for yourself rather than designing for SA, and if you are modeling in a liquid universe like the sp500 and need not care about how many people copy your model and trade as you do), perhaps public visibility is the way to go.
-
If you really do need/want private visibility, it may be worthwhile to develop a network of p123 trusted friends with who you can share your trading system and get private feedback. We even have, in the community, the capacity to create private groups and give you the ability to save your work with visibility keyed to members of a specific group.
-
Read modeling commentary elsewhere and teach yourselves the art of discussing your trading system in a way that genuinely informs readers but retains enough to frustrate out-and-out copying.
FWIW, when I look at my own sims, I never focus on details but do a very quick scan and conclude (a) ok, (b) maybe – needs work, or (c) piece of sh**. I never, never, never expect to achieve an actual return anywhere close to the reported simulation, return because that’s always impossible aside from luck. The un-knowable market is always the most important component. I evaluate everything I do in terms of relative-to-benchmark performance. If I have a sim that shows 18% a year and invest and lose 12% in year one, if the market fell 20%, then I consider the model to have met expectations. Conversely, if I make 22% but the market jumped 30%, I consider it a bad period for me. I start modeling with ideas I know should beat the market and use the sim as feedback regarding whether I succeeded in translating those ideas from plain English to language the database and server can understand and process, or sometimes to help me see if those ideas are translatable at all (not everything is).
Marc,
Large drawdowns can be avoided by using Fred Piard’s method of determining stock market climate by using various economic indicators. http://www.portfolio123.com/mvnforum/viewthread_thread,9792#52846
Here is my attempt at this as well:
One could for example only be in the market when the Market Climate Score is 0, 1, and 2. Then one will avoid the poor markets and the large D/Ds which come with bad economic conditions when the Market Climate Score would be 3 and 4.
I developed a ETF model which invests in 5 ETFs appropriately chosen for the five different market climates.
Just for fun let’s have a look at your free SA model Cherry Picking the Blue Chips.
https://www.portfolio123.com/app/r2g/summary?id=1056202&f=1
Seeing it is free, why don’t you publish the sim and ranking system, then I could run it only during the periods when the Market Climate Score is 0, 1, or 2 and see the improvements.
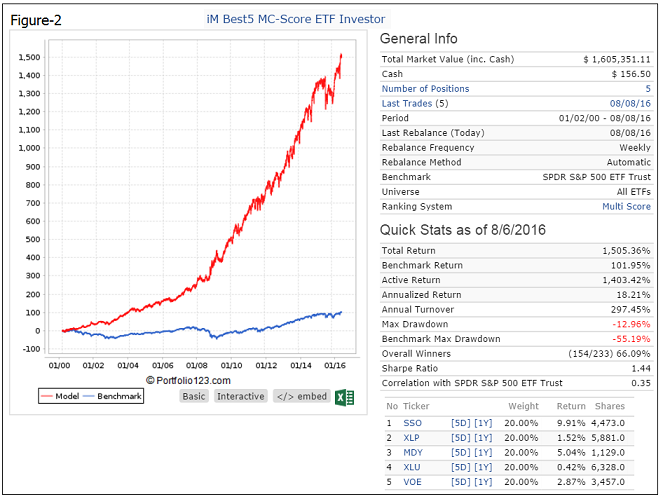
So what I did instead is to combine your model in a book with the iM Best5 MC-Score ETF Investor. This model has a low turnover and holds the ETFs on average for 5 months between trades.
Cherry Picking the Blue Chips has a max D/D of -58% and a CAGR = 13.8%.
When combined with the iM Best5 MC-Score ETF Investor, the combo has a max D/D of -25% and a CAGR = 16.8%, which is a lot more acceptable than the -58% D/D you seem to be so comfortable with.
I think Fred Piard’s method has a lot of potential, and now that P123 has a lot of economic data available it makes sense to use this data effectively to protect one’s investment.


Geov,
I am not a professional; but i have attended AAII fundamental investor meeting couple of years; most of the attendees are retiree.
One of the their major concern is economic data revision; job report revision and eps revision, etc., they have decades of observation and investment experience.
ministry of truth is all negative news around feb 2009, not in late 2007.
ie.,
Historically, if interest rate high, market will be at all time high;
But, Today, market is near all time high; interest rate is in near bottom.
Please, help to clarify whether economic data are most reliable in real-time?
Thanks
Kumar

The system is quite robust. I use indicators which are never revised, or very little revised. They are all reported either point-in-time (or within a week of point-in-time). The system does not require to be perfectly accurate in its timing. It makes very little difference if it switches from one score to the next delayed by a week or two.
Russell 1000 Index (no revisions).
S&P 500 earnings per share estimate based on the time weighted analyst’s estimates of current year and next year (small revisions possible).
Short Interest Percent of Float for the S&P 500 (small revisions possible).
The Aggregate Spread uses:
20-year US Treasury bond yield (no revisions),
Target Federal Funds Rate (no revisions),
Consumer Price Index (no revisions),
Unemployment Rate (no revisions).
The Hi-Lo Index of the S&P 500 (no revisions).
Were any of the things cited created before 2008 and successfully used, with real money, to dodge that drawdown? If so, great. If not, I suggest reserving judgment and moderating one’s confidence until we see how it plays out in the real world.
Marc,
I am using economic indicators, this has nothing to do with 2008.
Would you want to be in the stock market when the MC-Score is 3 or 4?


Geov,
At brk.b, full-time hiring freezed for entire 2016 year, 5% pay cut on all contract job, the same situation at most of the company, no aggressive hiring in private sector. Do you believe unemployment is really all time low, now?
The AAII investor concern is FED will revise the unpemployment rate and sp500 eps after 2 or 3 months. As adjusted revision in past months report.
Thanks
Kumar
What I or anyone wants is irrelevant. What counts is what we can achieve, and a market timing model that shows it solved 2008 after the fact but did not do so before the fact is guilty until proven innocent. (I don’t know what the MC-Score or what it has or hasn’t done with live money is so i can’t comment on it specifically.) And for the record, I did not take a big drawdown in 2000 or 2008 because my model – my brain – worked very well.
kumar,
Yes, there may be revisions to the Unemployment Rate, and they are published once a year. But most of the revisions are very small.
Attached are the official 2015 revisions from the BLS.
Note, there were no revisions.
unemploymentrevisions.pdf (600 KB)
Marc,
The MC-Score is described here:
Why should a method using economic indicators to signal stock market conditions be bad (i.e. market timing), while the design of a stock model with stock indicators is good. There is no difference in my view, both methods are good. In any case, if it was undesirable to use economic indicators for stock models, why did P123 see fit to provide them? I for one, am very satisfied that P123 has added the economic indicators to the available data.
Geov,
Here, the unemployment report for 2007, 2008 & 2009 from BLS,
You can see around 40% of the months got .1 revision.
P123 staff,
Please, help to clarify, unemployment data remain same without revision at p123 database (as point of time data) ?
Thanks
Kumar

Yes, there are small revisions. But this makes no difference to my model. It asks: is the UER higher now than 3 months ago. If yes, than you have a negative economic condition. This is not rocket science, or sophisticated market timing. Anybody can understand that economy gets worse if UER goes up.
Thanks
Kumar
That is why I have 4 economic indicators in the model and not just the UER. When MC-Score is 0+1+2, then model would have entered the market on Jun-22-2009.
Benchmark return and model return for SPY are the same from Jan-2-2009 to Aug-2-2012, about 60%.

As a rule of thumb, whenever anyone picks particular dates or figures to make a point, I like to look at why they were chosen.
For this case, P123 has provided a wonderful tool; the Multi chart. There’s even a pre-built chart named ‘Employment and Stocks’ that illustrates the data wonderfully. Looking at the 20 year chart, it’s clear that unemployment and the SP500 run counter to each other.
The period in question - Jan to Dec 2009 - the market seemed to anticipate a change in the economy and employment. It’s telling that initial claims peaked in March/2009.
Lovin P123,
Walter
Thanks
Kumar