I’m looking at very long term returns of individual stocks, as far back as we have data (1999).
For return from say 01 Jan 1999 to 31 Dec 2022, I’m using ret%chg(6024), where 6024 = 201 bars per year x 24 years.
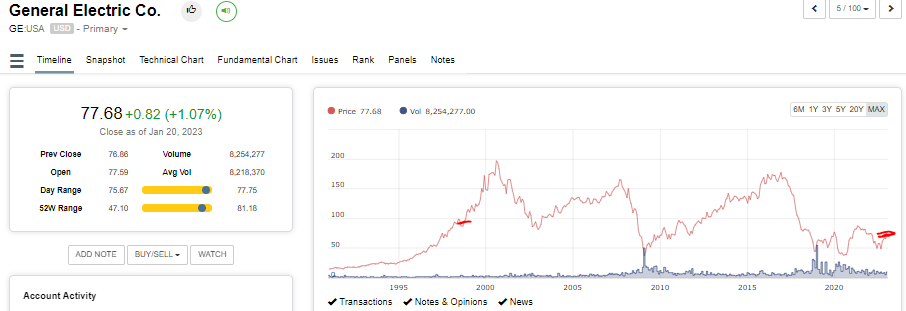
This is fascinating, for example if you bought GE at 01 Jan 1999, your absolute return at 31 Dec 2022 would have been -29% (or -1.4% CAGR).
Looking at the long term chart, this looks about right:
The first question though is whether this formula is split adjusted?
The reason I ask, if you look at SeekingAlpha data, the price data is very different:
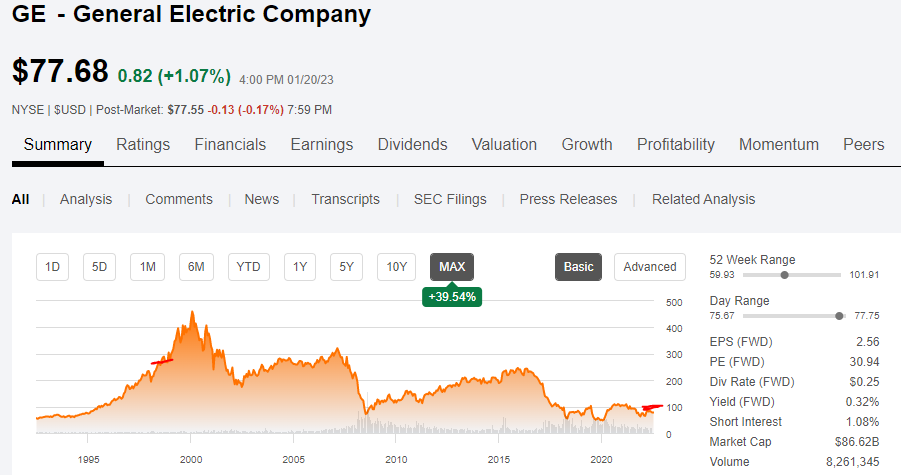
And 24 year return looks in the order of -66% or so.
A more extreme example is for AIG, where 24 year return is -99%:
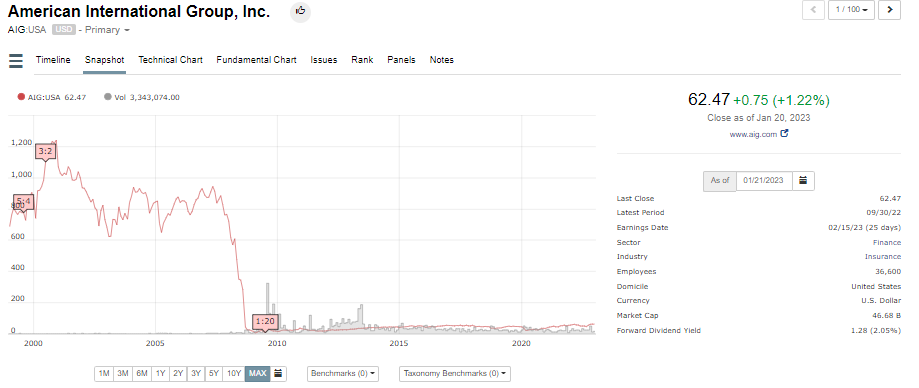
Our P123 indicates the splits, again is the overall price data for the long term calc split adjusted? Or is the -99% due to the splits?
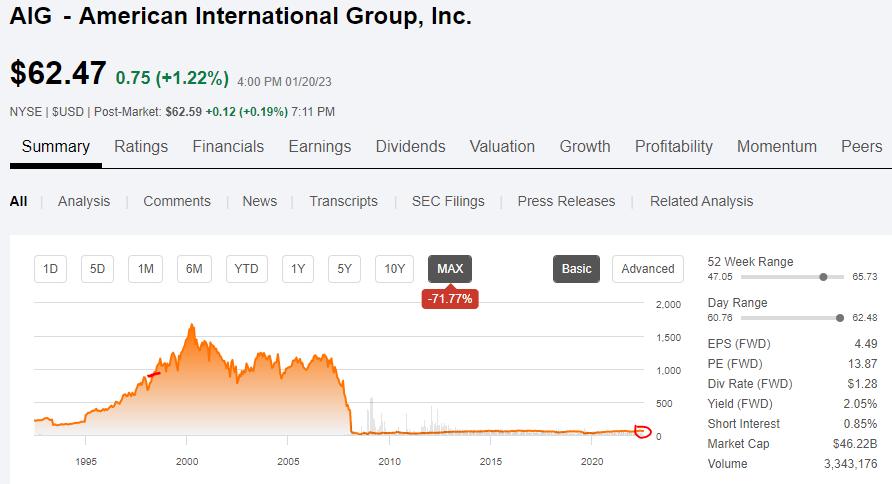
SA data looks to be about the same:
Thoughts?
Thanks!
Ryan