Statistics - Weekly Returns

I have been using weekly returns under "statistics" now for a while to some additional calculations that I use for books. There seems to be some issue with how this is calculated, or it does not reflect the "week". I will use one of my strategies to show, by example, the problem.

Note: this is a simulated strategy, but I have it also live. Please note that this is NOT related to PIT or live vs. simulated differences.

First here is a screenshot of the statistics page which, by default, always shows monthly:

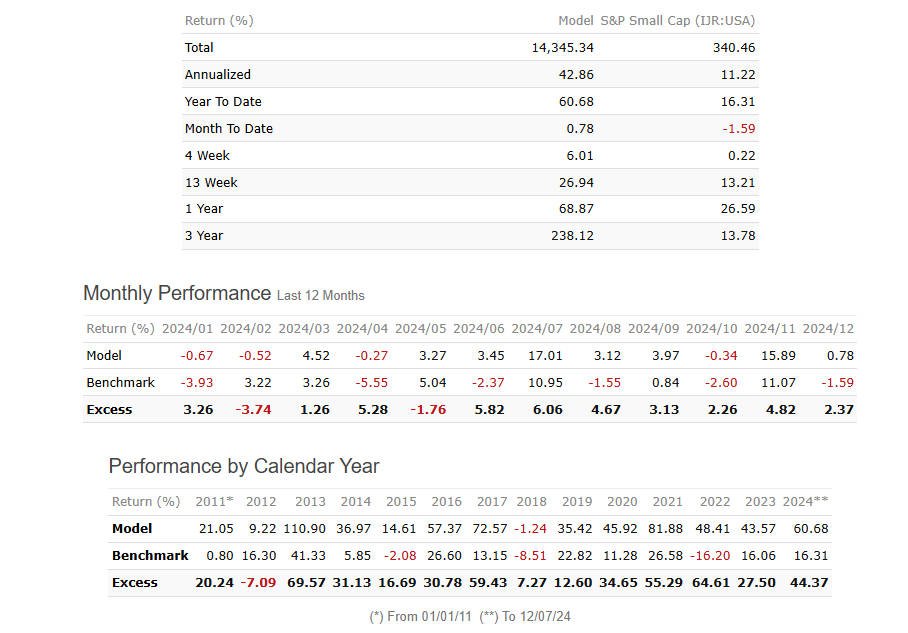
As can be seen by the return for December, the strategy returned 0.78%. Also, because the monthly, weekly boundaries align for this month, the "month to date" also shows 0.78% .

If I go to the strategy overview page and select the performance tab:

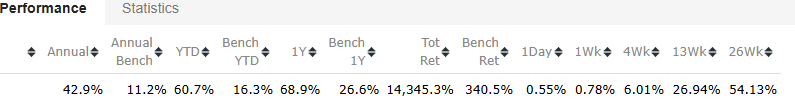
Again, 1 week return shows 0.78%. The three reported returns are consistent and is also correct (as per my live port which I track separately as I want daily data).

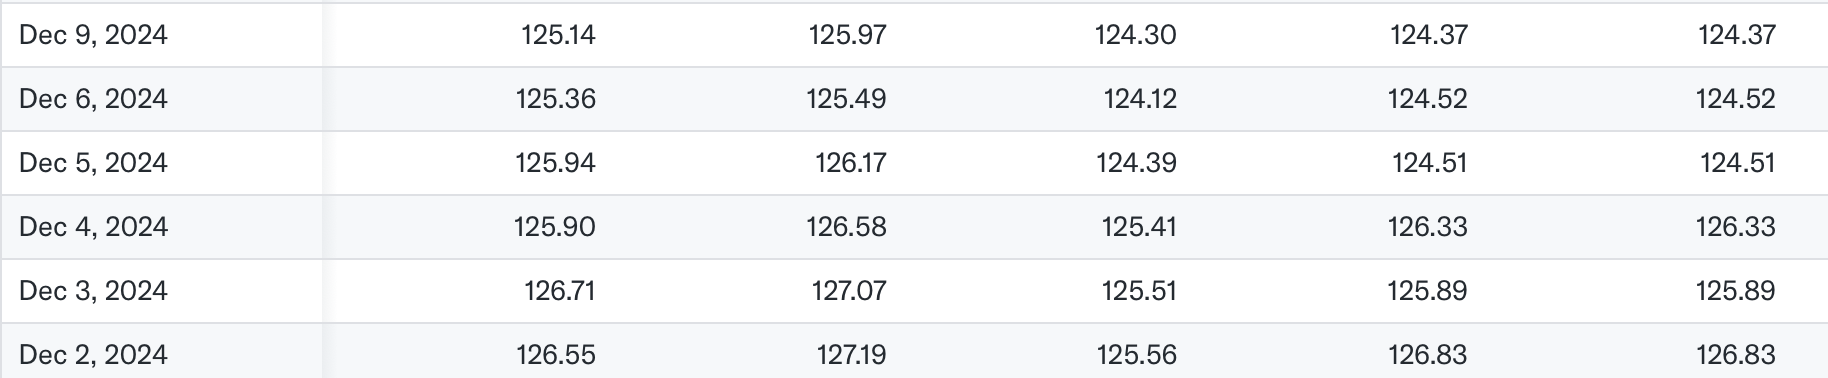
Back to the statistics page. On Chart data section, I have the option of weekly, monthly (default) and Yearly. If I the download button on the chart of "Monthly returns since XX/XX/XXXX", I can get the return per period since the start date. With the monthly option selected, I get:
image
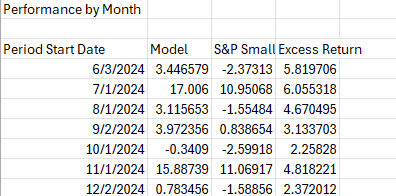
Note: for the purposes of this email, I have only shown the last few rows.

Again, unsurprisingly, the return for the month commencing 12/2/24 is 0.78346. The monthly returns also all aligns with the monthly performance (last 12 months). So up to this point, everything is correct and consistent.

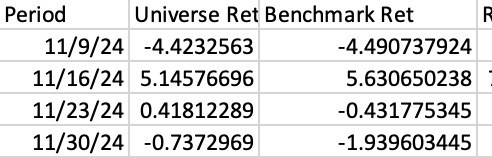
Switching the Chart data to weekly return, and downloading "Weekly returns since XX/XX/XXXX":
image

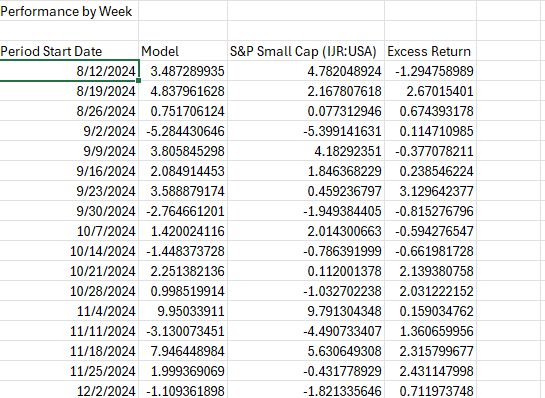
Now, things get strange. The weekly return for the week of 12/2/24 shows a loss -1.109361898. I KNOW this is wrong, because as I said I have verified using four different approaches that the return was 0.78%.. But this isn't where is ends. If I use this data to calculate the 4 week return, it is different from the 4 week on the statistics page. The strategy shows a 4 week return of 6.01%. The downloaded weekly data shows a return of 5.4751. The 13 week, 26 week are also wrong/different.

Can someone take a look at this and advise.

Thanks,
Simon

It appears to be measuring Monday/Monday performance. I'll work on correcting it soon and also check that Monthly and Yearly are also working as expected.

1 Like

You want to change that? Monday close to Monday close is a bad thing if I understand correctly? Probably I don't understand.

BTW, the original post was on a Sunday (Dec 8) so the next Monday's close data would not have been available at the time of the post and the numbers for the S&P Small Cap (IJR:USA ) benchmark returns have changed in my screenshot to avoid any confusion with the numbers in the original post.

This got me checking the rank performance test. We want Monday close to Monday close there to avoid look-ahead bias for the rank performance test as we are using data that comes in over the weekend and we generally cannot invest on that information until Monday's market open. Focusing on the S&P Small Cap (IJR:USA ) benchmark for which we have public data I get this download from the rank performance test:

Screenshot 2024-12-11 at 5.49.04 AM

11/30/24 is a Saturday and I hope the -1.939603445 is for Monday close 12/2/24 to Monday close 12/9/24 for S&P Small Cap (IJR:USA). Looking at Yahoo;

I calculate that Monday 12/2/24 close to Monday 12/9/25 close number to be -1.939604195% which as it should be (with rounding errors), I think. Do not change that for the rank performance test would be my recommendation. You are probably thinking the same thing.

But while look-ahead bias may not be as big of a concern for sim downloads maybe keeping Monday close to Monday close there for consistency would not be a bad thing. Maybe (probably) I misunderstood aschiff's post but maybe we should not change what is in place now for the rank performance test or weekly downloads.

Jim

In this case, the transactions have already happened. If performance is computed Monday to Monday, rebalances end up being attributed to the prior week's performance because the strategy on Monday close already has the transactions executed. The strategy's return at Friday close is reflective of all activity for each week and can't introduce any lookahead bias.

A problem, I think, when the price of the Friday close before the purchase for the sim or port is used for the next week's returns. Wouldn't it be?

So in any case the rank performance test seems correct.

For it we get full data (the signal) Monday morning can rebalance sometime Monday and buy with a limit or market order sometime Monday. Then sell it the next Monday after getting a signal to sell on the previous weekend. No look ahead bias.

P123 already does it that way for the rank performance test, I think, and I complement them on that if I am correct about that. And thank you for updating the API download to that method not that long ago.

Not sure that we would have to change that for the sim downloads but maybe not a problem if people are not using the download as price signals and don't mind the discrepancy with the rank performance test and the API downloads.

We're strictly talking about converting the strategy's performance, which has already been computed, from daily to weekly here.

The strategy's performance is computed using the positions at the close, after that day's transactions, with their corresponding close prices. Each bar of the strategy's return represents its total equity at the close. So I think Fridays are better for week over week.

Thank you for your response. I cannot think why that would not work.

Weekly should be working as expected now.

Thank you. I will check everything tomorrow after the 10:00 update

Update: checked all the calcs and everything is consistent now. Thanks.

BTW, when switching to weekly, the performance chart is not displaying

Weekly:

Yearly: