Suggestions for improvements

In this topic we will provide suggestions for improvements.

My first is related to 'Features Stats' tab.

  • allow to remove features with thigh % of NA from this tab rather than go to 'Features' tab
  • add filter to allow select all features with with more than X% NA.

2 Likes

We need to do some work here for sure. It's missing key information.

For example the problem with Surprise%Q is that proper coverage starts around 2004 (not sure the exact month) , but at least 1 stocks has a value back in 2001. This makes the Min Date column useless if you want to keep that feature and just adjust your dataset start date to around 2004.

Second problem is UX problem that is very hard to delete features you don't like. You have to jump back and forth or something.

Thanks , we'll get right to it.

  • Show correlation between models performance . Very useful to decide which 2-3 predictors combine into ranking system.
  • (in 'Portfolio and 'Return' tabs) Show performance of combined models either by rank predictions or selecting total/n top stocks from from n models, where total is desired number of stocks in portfolio.
  • Rather than using Quantiles, allow to use # of stocks to measure performance
  • allow to filter by only validated models in tab 'Add Predictors' - whit many models of similar names it is quite easy to be confused.
    Or fix slicer 'Show Used' for this purpose - it seems to does not work

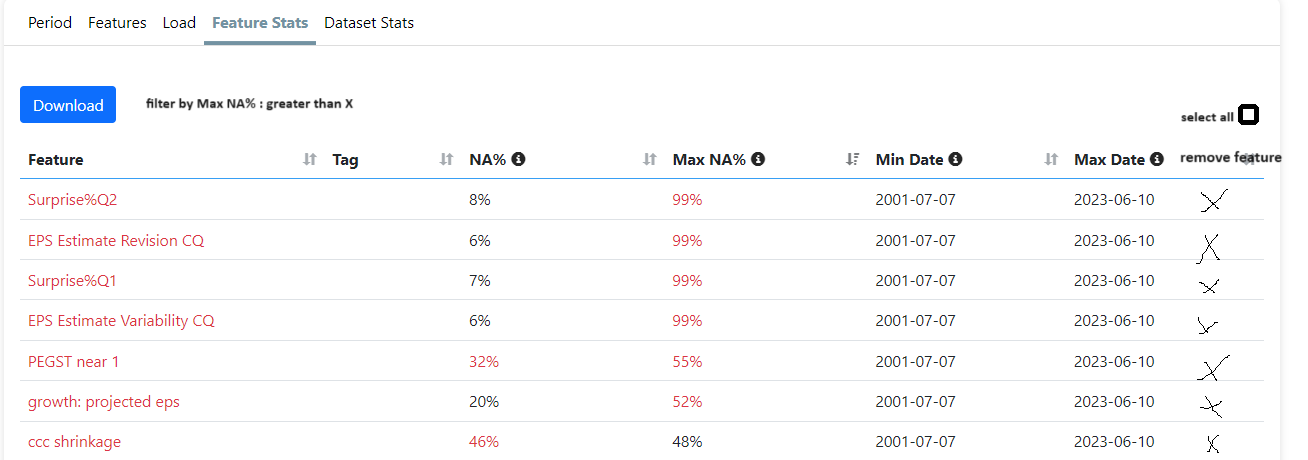
Also a problem for earnings estimate revision up until about 2005, I think. And others features. I had to remove a few features (two features). And/or change the data period for earnings estimate revisions.

i learned something about some of my factors and NAs are a problem and ways to deal with them, e.g., impute etc are important. .Something I am usually too lazy to do.

But I think this is also true: NAs are not as much of a problem with tree models as it is for a linear regression model.

Sorry to admit this but I asked ChatGPT about this. It would go along with "less of a problem" with tree models but I could not get it to say "no problem."

Still you could imagine a random forest (or HistGradientBoosting being a better example) making some of its splits right at the NAs bucket or empty bucket. Ideally, at times, splitting the data into NAs and not NAs (or zero buckets), And even recognizing the times where being NA is useful information.

For example, a small stock with no analyst coverage and therefore giving an NA for Surprise%Q could actually do better because of the lack of analyst coverage (and P123's AI using other data that is not being followed by a lot of people).. A tree model could, at least in theory, recognize this.

Anyway, no conclusions on my part but I am not convinced that the threshold for removing a factor should not be at least different when using a tree model.

@Pitmaster and @Marco, I have this idea for discussion. Why not give NAs a NEGATIVE rank and give the NA returns for those buckets. Therefore a tree model can always, consistently split on the NAs. as the number of NAs changes throughout the years. And use that information.

So again, embarrassed to admit but I wanted to get a first impression of my idea. As per ChatGPT: "

Negative Ranks for NAs:
"Assigning a negative rank to NAs could ensure that the tree models consistently recognize and split on NAs, treating them as a distinct and potentially informative category.

Consistency Over Time:
By giving NAs a specific rank (e.g., negative), you provide a consistent way for the model to handle missing values across different time periods, which can help in making more reliable splits."

Conclusion: You should probably do something like that for tree models unless I am missing something. Forget imputation etc.

Keep and use any information that the NA category or classification provides.

Jim

2 Likes

The intended workflow here was to favorite models you want to add as predictors on the Validation/Models page, then when you're ready, you can use the ⋮ menu to copy them over one at a time.

Show Used is meant to let you add the same models multiple times for validation, useful only when when randomness is involved in the model.

The AI Factors User Guide is a nice introduction for individuals with no machine learning experience.
But it doesn't show up when you initially enter the AI Factors aera. I was using the site for 4 days
before I stumbled onto it.

1 Like

@marco What do you think about adding a metric that shows the delta between validation and testing results?

It's sensible to look for consistency between those time periods. Perhaps the model that is most consistent in it's validation performance and testing performance is most robust.

Agree:

A few thoughts:

  • Other people have mentioned this, but a clear transition of the data from validation to the predictor (which I assume is used for ranking/screens) would be great. Or make the predictor use time series training so that the predictor is from a model trained every x weeks.
  • I have not done this yet, but I would like to know that my model is fairly stable and that I don't get massive variations every time it is trained. Maybe you have already checked this, but it would be nice to see variation in stock picks or returns over say 10 training/validation runs. If it is super consistent then not a critical feature.
  • Others have also mentioned this but having a non-scaled prediction will allow a return less slippage calculation for position sizing. Or as others have suggested use it to only rebalance if the expected return drops below zero. I think without the prediction being a true value its hard to use the results to their fullest!
  • Do any of the algorithms use the validation data for early stopping or such? If so do we need to worry about data leakage, and if yes can we have a rolling test period as well? I think this would be more critical if P123 implements recursive feature elimination or other hyper parameter training using the validation data.
1 Like

Is there any way to expose the AI Factor? There may be valuable insights there. For example, out of 300 factors it might be primarily using 3 or 4 in a certain way.

At a minimum, it allows me to robustness check using certain elements of it. In a traditional ranking system I like to adjust weights, remove some factors and so forth to see if the core idea holds up or how dependent it is on the optimized weighting. Doing this allows me to use my training period for robustness checking in addition to out of sample periods.

What would the code even look like?

1 Like

Assuming you literally wanted to look at the code, once you have run an extra trees regressor you could run this to get an output of which features were most important. Something similar can be done with XGBoost. For linear regression you can output the coefficients.

Specifically, feature importances tells you how many times the program thought that a particular feature was the most important feature in a split and how much the split reduced a metric—often mean squared error.

I believe Marco said he will be doing all of the above at some point.


# A regressor example
etr = ExtraTreesRegressor(n_estimators=100, random_state=42)


# Get feature importances
feature_importances = etr.feature_importances_

# Create a DataFrame to display feature importances
feature_importances_df = pd.DataFrame({
    'Feature': X.columns,
    'Importance': feature_importances
}).sort_values(by='Importance', ascending=False)

# Display feature importances
print(feature_importances_df)

Jim

1 Like