Surprise in short interest

The paper from Matthias X. Hanauer proposed SUSIR metric.

Conceptually, the formula calculates how far the current short interest has deviated from its 12-month average (the numerator) and then scales this deviation by its historical stability (the denominator). A large deviation from a historically very stable level of short interest results in a large SUSIR value, signaling a significant "surprise." Simply: the zscore of most recent value vs. previous PIT values.

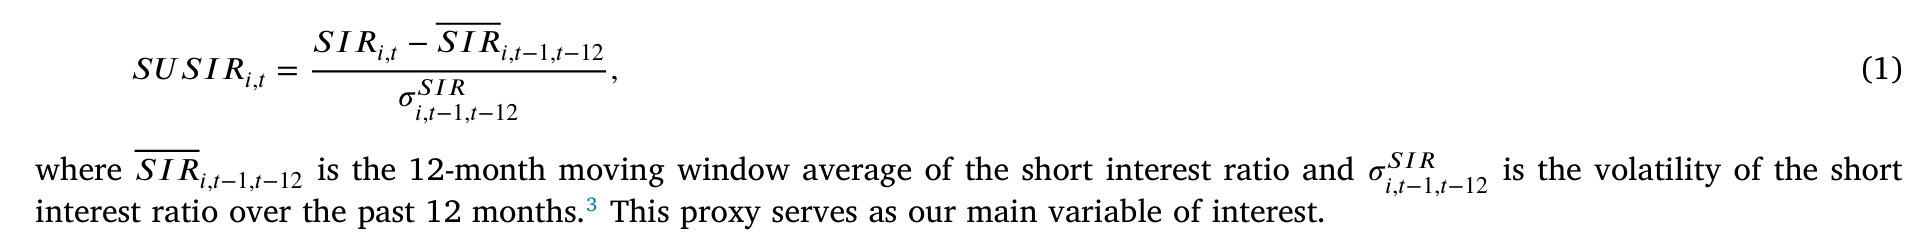
SUSIR = (SIRatio - LoopAvg(FHist("SIRatio", CTR), 12, 1, 4)) / LoopStdDev(FHist("SIRatio", CTR), 12, 1, 4)

Alternatively: FHistZScore(SIRatio, 26, 2)


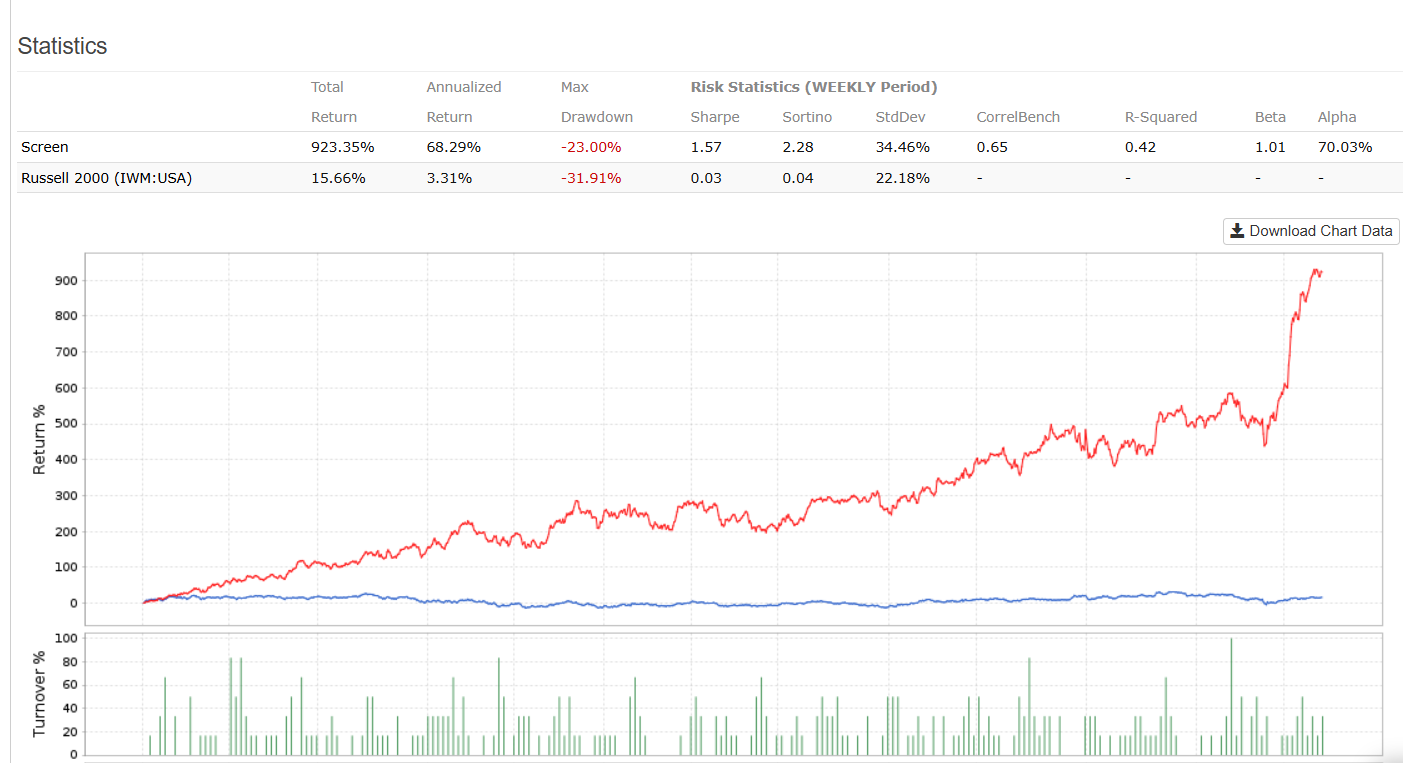
The performance seems to be encouraging:

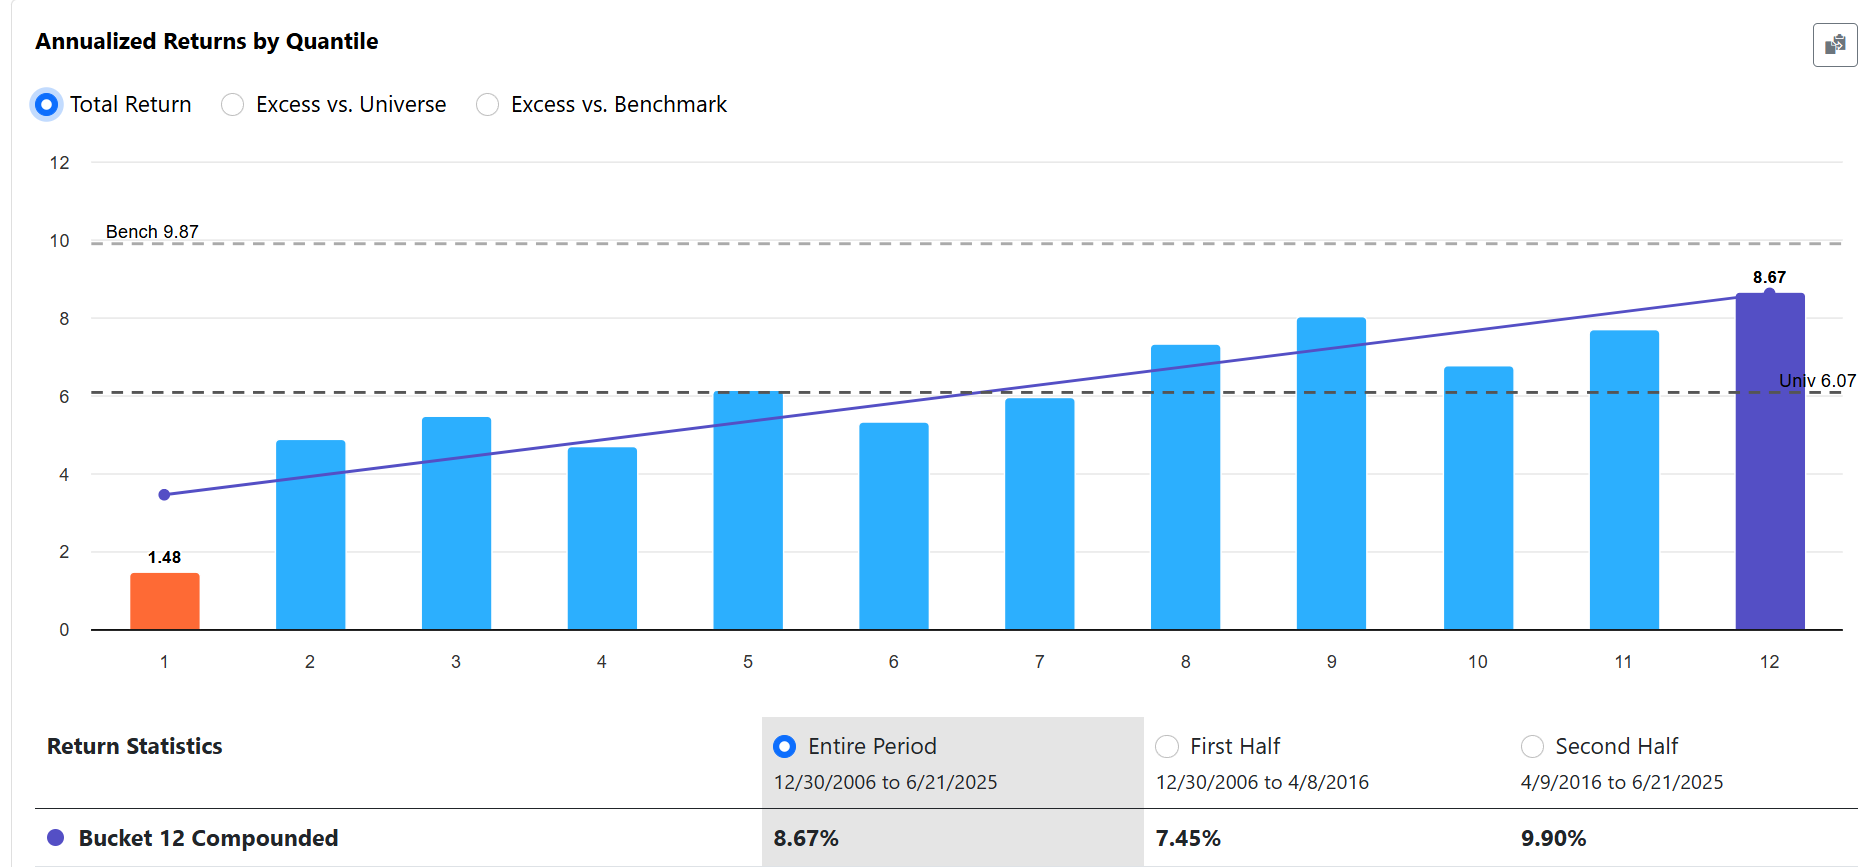
SUSIR, lower is better, Easy to Trade US

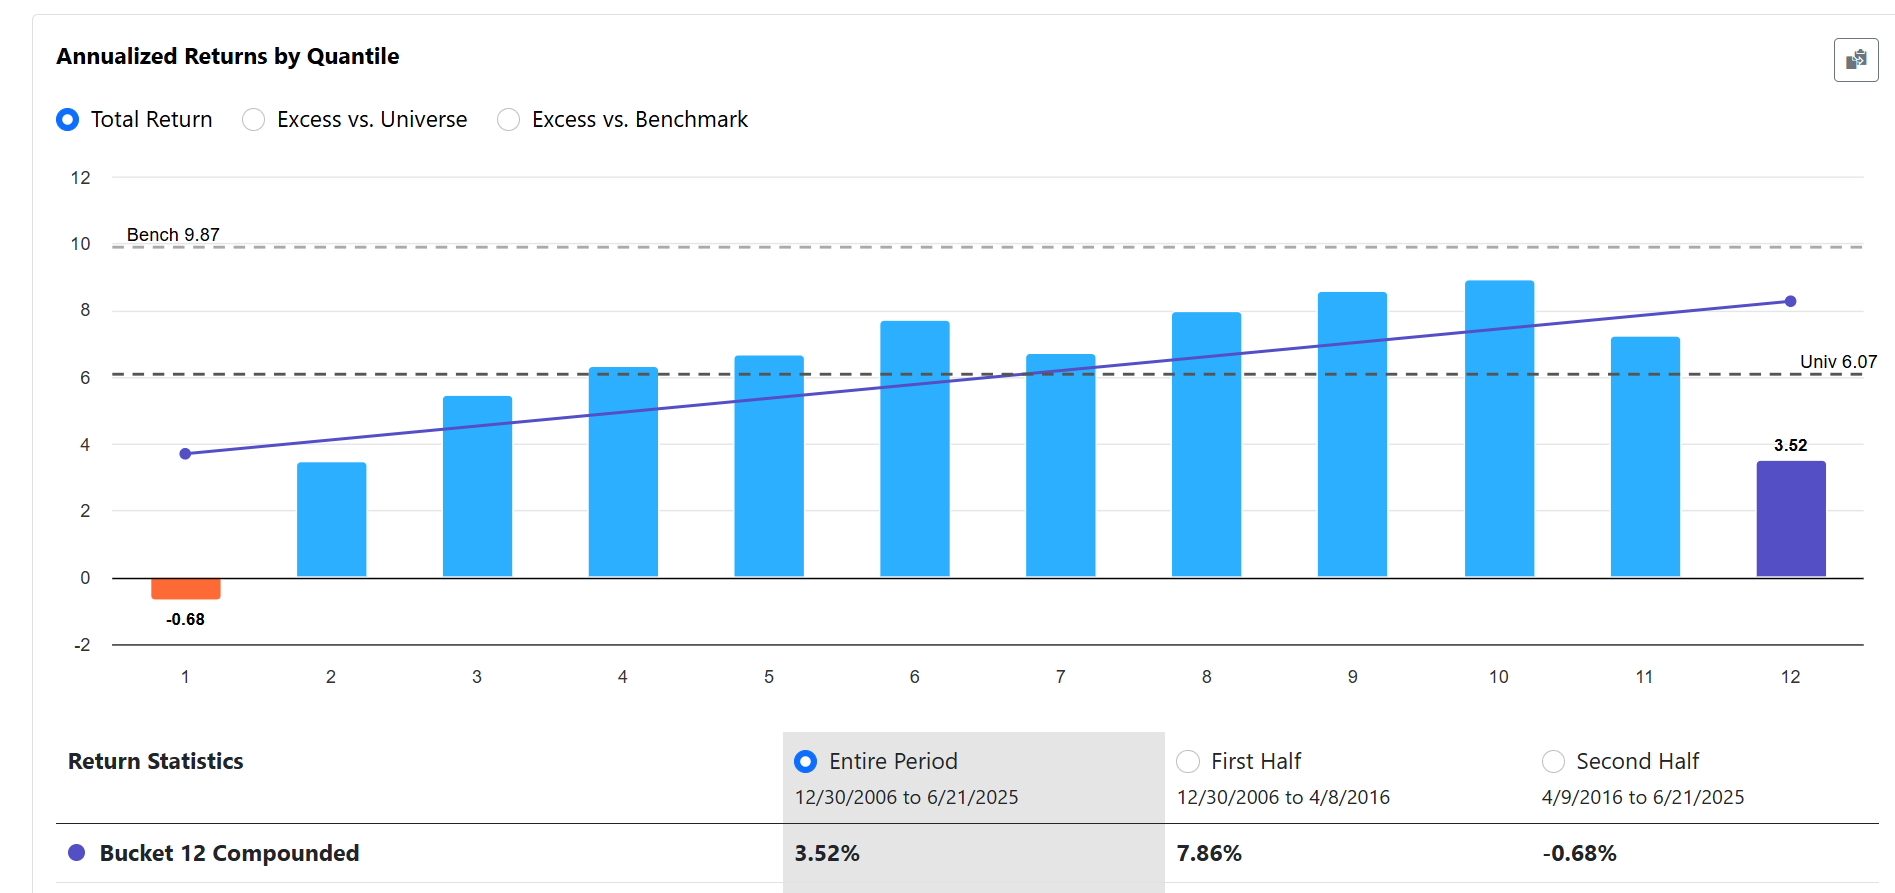
SiRatio, lower is better, Easy to Trade US


Surprise in Short Interest by Matthias X. Hanauer, Pavel Lesnevski, Esad Smajlbegovic :: SSRN

edit: Due to formatting issues, the formula is not displayed correctly. Please edit it by adding a backtick before FHist and after CTR) to make it work.

5 Likes

My conclusion: you don't need machine learning tools or nonlinear transformations (e.g., abs(70 - Frank)) to make the formula work. :slight_smile:

1 Like

Thank you for bringing this to my attention. I spent a portion of the afternoon working with it and it seems to go well with the more volatile half of the market (Between(Rating ("Core: Low Volatility"), 2, 50)) and a Growth RS. This is what I came up with:

Cheers,
Rich

3 Likes

Thanks. Please help me understand the logic of this.

Also is following the same as the formula mentioned above - (SIRatio - (FHistAvg("SIRatio", 13, 4))) / FHistStdDev("SIRatio",13,4)

When I try to run this formula as a ranking system rule:

I am getting an error message:

Ranking failed on 01/01/2005: In 'Surprise Short Interest Ratio'-> LoopAvg() requires the 1st parameter to be a quoted string

I'm not sure what I'm missing. Please advise.

Chawasri

You need to use backticks to make it work:

The fundamental goal of this formula is not to measure the absolute level of short interest. Instead, it measures how unusual the current level of short interest is compared to its own recent history.

The ratio you provided is very similar. It samples SIRatio 13 times every 4 weeks, instead of 12 times every 4 weeks.

thank you!. however, when i back test this and buy the top ranked stocks accoording to this formula - i get a backtest similar to the market performance. So i was trying to understand the universe and ranking used. And see if I can find an economic or behavioral explanation.

This ratio is not very strong in isolation. The key point of my post is that SUSIR seems to work better than the commonly used SIRatio.

2 Likes

Sorry, I don't understand the reference to 'backticks.' Can you provide an example or share the formula to ensure it works correctly? Thank you.

Back-tick (`) : the little accent mark that shares a key with the tilde (~), directly left of the 1 key.

In P123, use it whenever a string is nested inside another quoted string.

Here SIRatio is a string inside FHist(), which already sits in double-quotes, so back-ticks are required:

(SIRatio - LoopAvg("FHist(`SIRatio`, CTR)", 12, 1, 4)) /
LoopStdDev("FHist(`SIRatio`, CTR)", 12, 1, 4)

Oh, so that's what we call it! OK, thank you!

I was pinged by another member asking me to share the reasoning behind the screen results that I shared. From the backtest log:

SCREEN BACKTEST LOG 06/26/25-15:57:54

Screen id 313947
Period 01/02/2021 - 06/24/2025
Rebalance Days 7

RULES
Common Between(Rating ("Core: Low Volatility"), 2, 50) // 2 50
Common NetFCFLMgn%TTM >= NetFCFLMgn%PTM * 1.13
Common Between(FHistZScore("SIRatio", 26, 2), 0.35, 3.4)

SETTINGS
Method LONG
No Stocks 6
Slippage% 0.2500
CarryCost% 0.0000
Long Weight% 100.0000
Short Weight% 0.0000
Rank Tolerance 0.8000

Between(Rating ("Core: Low Volatility"), 2, 50) : A style that I use is starting with a large portion drawn from one of the available Ranking Systems. The 2% exclusion from the bottom is because I'm not comfortable with this tail. It also provided a modest total return increase.

NetFCFLMgn%TTM >= NetFCFLMgn%PTM * 1.13 : I grabbed a couple of secondary rules from a fast dividend growth screen being revisited. One was horribly negative. This rule came in as a 1.05 multiplier and raised towards the end.

Between(FHistZScore("SIRatio", 26, 2), 0.35, 3.4) : I encapsulated the short formula provided within a Between function as I like to see what trimming tails impacts results. I've observed that when working with Short Interest data that trimming some of the "best" results is useful which I ascribe to the "impossible to short" situation distorting the "true" opinion. Values determined by what maximizes total return.

Universe is liquidity constrained NOOTC based which has 3300+ stocks.

Rank Tolerance is 0.8% which reduces turnover from 30% to 20% and provides a moderate total return boost.

Ranking System is the provided "Core: Growth". The Risk Statistics period is Weekly.

Holding 6 stocks is because my approach is to have multiple small screens that battle it out for funding.

Cheers,
Rich

2 Likes