The factors below are correlated with returns in a P123 Rank Performance Test but shows what looks like zero in the Target Information Regression in the AI Factor Beta. The numbers to the right are NA counts as most of you know:
Here is the correlations from the rank performance test for the first factor above documenting the presence of significant correlation that the Target Information Regression is not picking up above:
I don't think it is supposed to be like that. The Target Information Regression should be able to find this correlation, easily. This is unexpected for sure. Error somewhere? The Hyperparameters need to be changed? Not a good test?
I think most of the literature suggest it should be a good test and be able to find significant correlations like the above example. But I have not had the chance to look at this with DataMiner data yet. For now, definitely unexpected.
I've been puzzled by how the factors are ranked in the mutual information. A few factors seem to have their ranking very high one time and low another.
Trying to understand the different ranking methods came across this simple experiment one person ran who was also trying to understand it. mutual information "mutual_info_regression" - Google Search
I'm many years away from statistics courses, I sometimes need simple examples to see some light.
TL;DR: This is a nice feature. Extremely advanced and just plain cool. Please fix it.
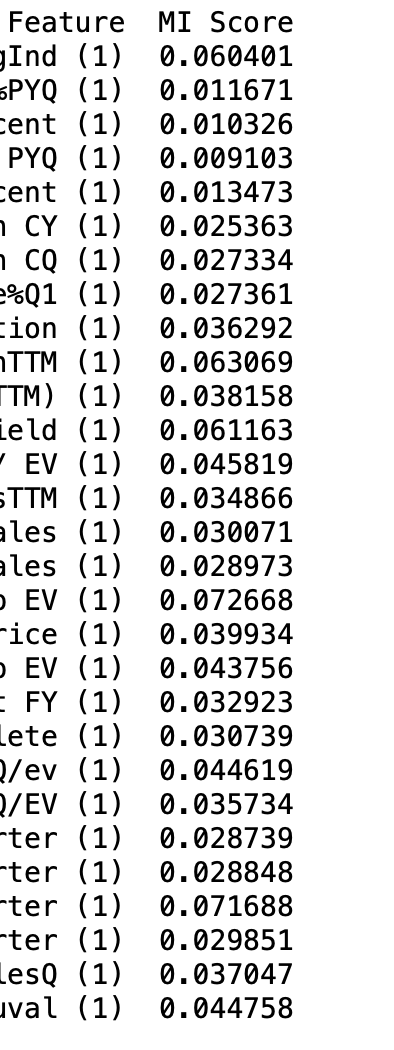
I ran it on some factors downloaded with DataMiner. I cut off the full feature names:
These number make sense and would be very useful!!! Specifically, the numbers for the factors in the post above were not zero and probably reflect their true importance. For sure, I do not need to be mislead into removing those factors.
Use my code and see if you get different results from AI Factor Beta if you have any downloaded factors to test:
from sklearn.feature_selection import mutual_info_regression
import numpy as np
import pandas as pd

# List of factors
factors = []

# Read data
df8 = pd.read_csv('~/Desktop/DataMiner/xs/DM8xs.csv')

# Combine data for training
df_train = df8.copy()  # Use copy to avoid setting with copy warning

# Drop rows with missing values in any of the factors or target column
df_train.dropna(subset=factors + ['ExcessReturn'], inplace=True)

# Define features (X) and target (Y)
X = df_train[factors]
Y = df_train['ExcessReturn']

# Compute mutual information scores
mi_scores = mutual_info_regression(X, Y, n_neighbors=3)

# Display the mutual information scores
mi_scores_df = pd.DataFrame({'Feature': factors, 'MI Score': mi_scores})

print(mi_scores_df)
Thanks for the code sample. I loaded an old P123 data set that I already knew had a few factors that were useless plus one that I liked but had inconsistent scores on P123. No results scored 0 and the ones I knew were useless scored below 0.01. Up until a couple of months ago I was adding a random column and using the random forest built in Global Feature Importance. A random number column scores ~ 0.001 but not zero for some reason.
I think that is what @marco was going for. Personally, I think I could use it. At least grossly, getting rid of the 0.01 or 0.005 and below factors (you set the threshold) to start. Or start with the smallest MIR and do recursive feature elimination.
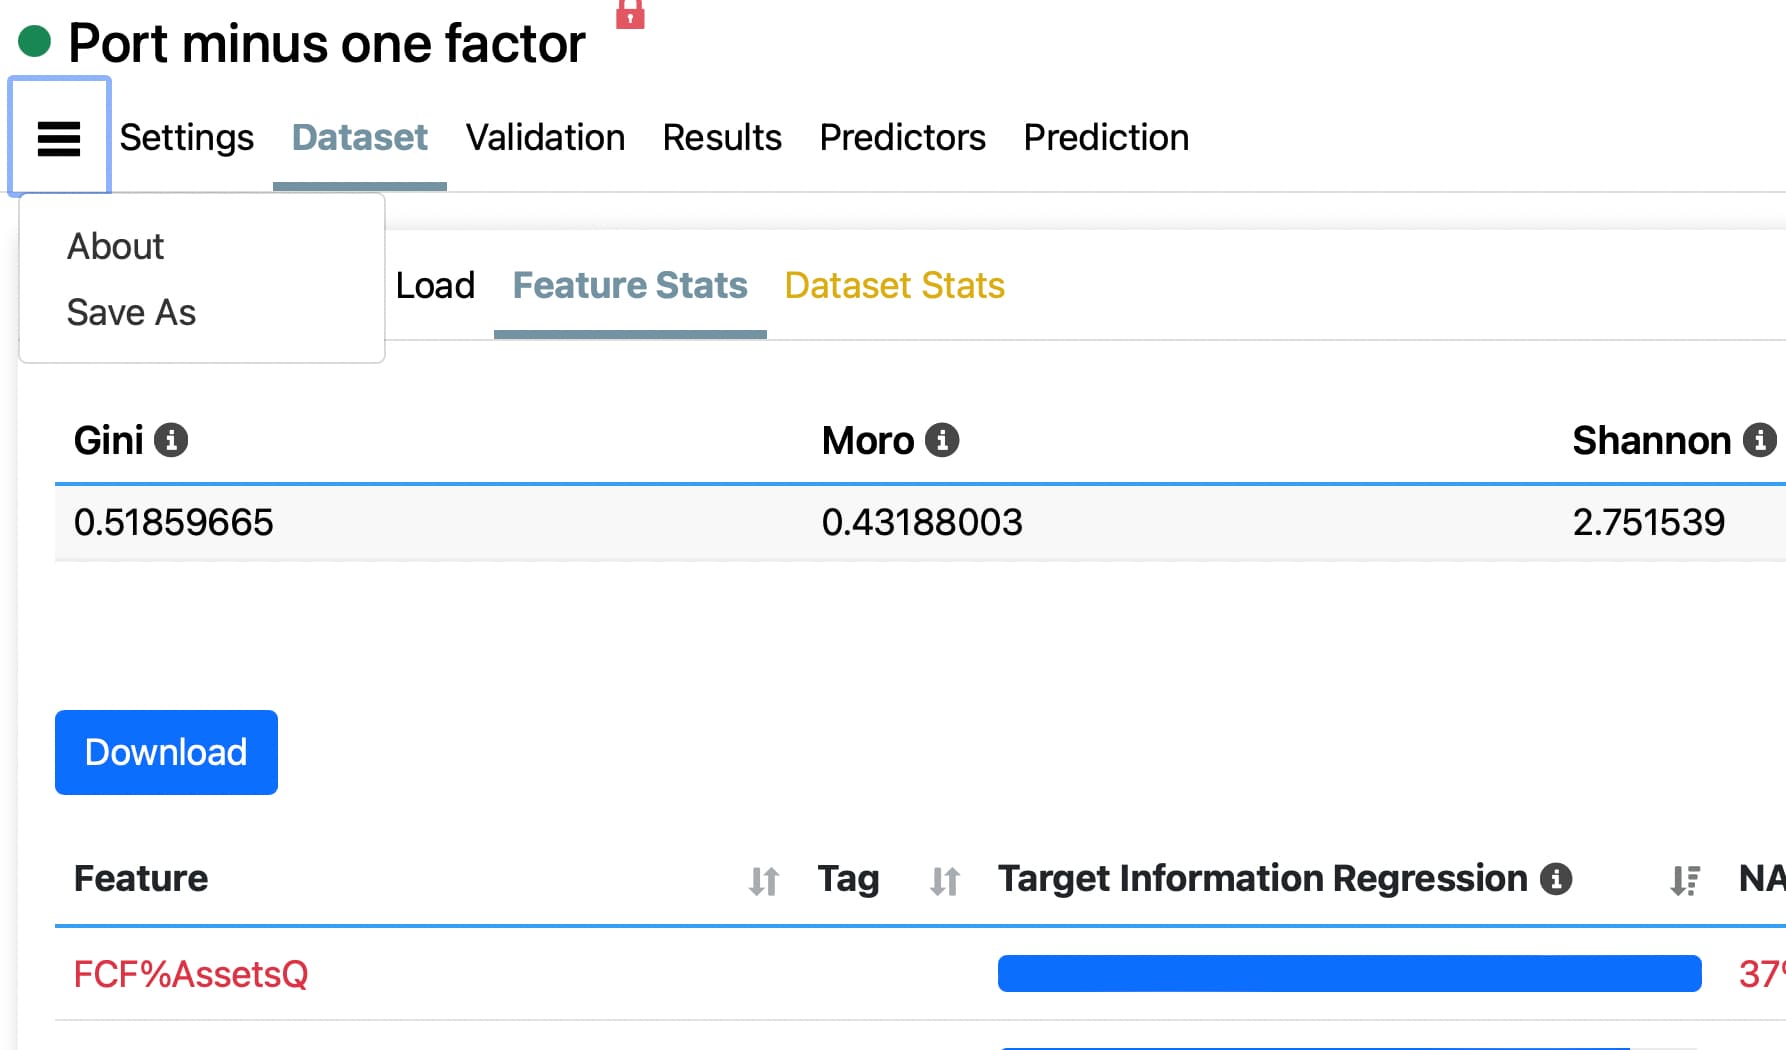
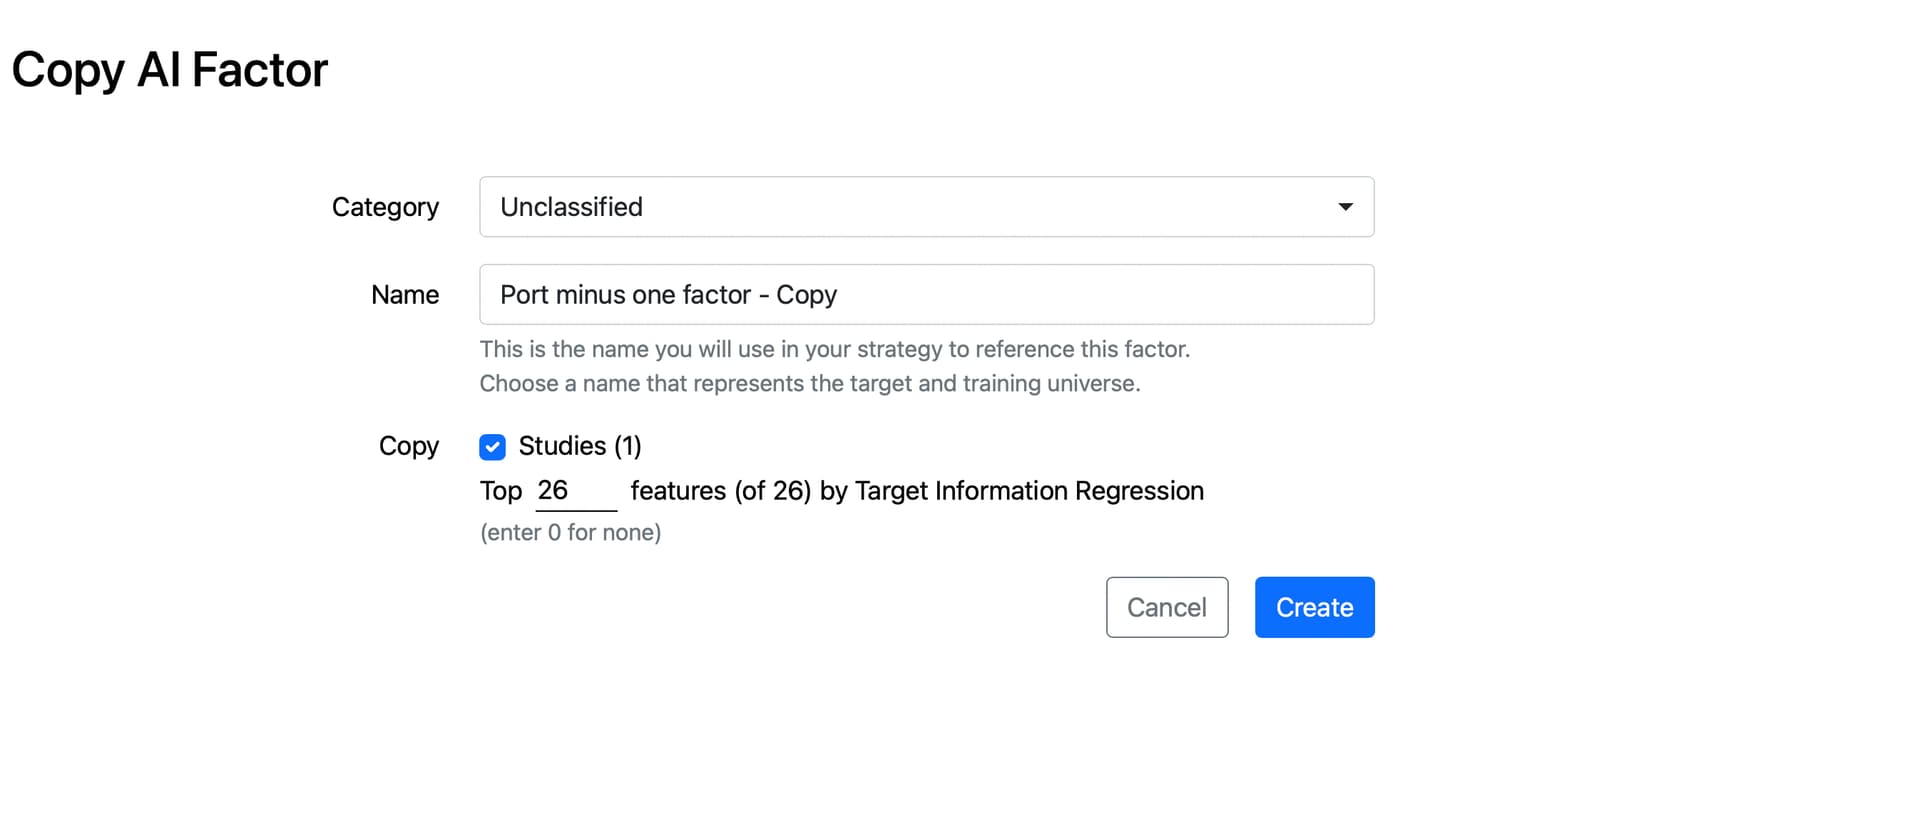
But also "Save as" here gives you a dropdown menu for SelectK:
Marco / P123 has put a lot of features in this site. It’s been a whole week now and we are still finding new options. Downloading data will always allow anyone to experiment with methods or data munging to enhance the results but for most the prepackaged system if very usable and relatively user friendly.
Thanks we'll investigate. It's pretty straightforward and I think we are using the defaults. We'll run some tests
Any of the parameters worth exposing in the UI like n_neighbors and random_state?
Also just noticed n_jobs which I think is new for 1.5. Might warrant a backend upgrade since its very slow for large dataset. We're currently using 1.3.2 since there was no pressing need to upgrade.
Not sure on this. I used the defaults. I don't know if tuning the n_neighbors could help give more consistent results with some features. The default of 3 does seem small.
I would make sure to use excess returns. Maybe you are already doing that.
My theory is that it is that program is finding a pattern (or false information) created by NAs. Not necessarily the NAs themselves as this program uses neighbors of NAs when doing K-nearest neighbors. And any associated zero-return buckets would probably cause a problem.
Any ranks that are reliably zero would be an obvious pattern the program would call "information" for some variables and create noise for other variables. Create noise that overwhelms a true signal for some variables. Excess returns would mitigate some of that, I think. But not necessarily completely eliminate the problems of NAs.
For tree models—and for target information regression, I think--giving NAs a negative rank might solve this and improve the model's accuracy. The tree model would reliably make a split at 0 rank to separate out the NAs when they need to be separated out. I think target information regression would behave better also. I would want to confirm that by testing it of course.
I am not sure of a general solution for NA in all models, including linear regression say. Maybe that would be a different solution as making NAs have a negative rank seems optimal for tree models. But if NAs are found to be the problem, now might be the time to open a discussion on solutions. Internally and in the forum.
BTW, I think NAs cause problem with linear regression too. The zero-buckets make things look pretty non-linear for sure. Factors that would be pretty linear without zero-buckets.
Obviously, I don't know anything for sure at this point. If I were brainstorming this in a group some of my opinions would almost certainly change instantly--with new ideas and insights presented in the discussion.
It is a nice feature and I know you can get it to work effectively. Thank you for listening to my ideas on the subject.
@Jrinne With the DataMiner you can only download rank data w/o a data license. Are you comparing apples to apples? Can you share DM8xs.csv?
Mutual info regression operates on preprocessed data using the preprocessor settings of the AI Factor. Only using rank preprocessor can the data be made to match the data downloaded from DM.
Which duplicates what I am doing with AI factor beta. I am sure I use ranks there. I tried z-score once and got poor results. I use ranks for DM downloads and Beta AI Factor preprocessor.
I took the liberty of masking the factors f1, f2, f3,…..f33 which may be easier for you anyway. I assume that is not a problem.
Probably self explanatory but I added a Column called 'ExcessReturn' which is excess returns relative to the universe.
I also added a column called 'Class' which is just 1 if positive excess returns and 0 if negative excess returns. Other than these 2 new columns, the csv file is unmodified after the download from P123, I think.
Unmodified except that I tried to upload the entire file twice and could not. We may have to use Google or something if you need the entire file for some reason.
I think this has 100 rows (1,000 rows was too big on the third try). It should give you an accurate idea of the download and the Pandas DataFrame the code was using, I think.
My Target was ExcessReturn in the code I provided. Also note that I have concatenated DM1xs, DM2xs,….DM8xs or over 21 years of data and am getting results that make sense over that time frame (retains factors that I would expect to have information based on a P123 Rank Performance test).
Your AI Factor Preprocessor settings are correctly set to Rank/By Date, but there are still significant differences in methodology to note.
By default, FRank uses the lowest bin for imputation (#InclNA). Instead, #ExclNA needs to be specified to preserve missing values and to match the binning behavior of the preprocessor.
The target is also preprocessed according to the same Preprocessor settings. All data fed to mutual_information_regression are preprocessed.
AI Factor data load discards rows based on NA's before any preprocessing (i.e. before ranking). Two rules are applied. 1) For each row, count NA's among features and discard those exceeding 30% of the number of features (truncated). 2) Discard rows whose target is NA.
After doing this, rows can still have missing values; this is dealt with later.
Since FRank is run before row discards, results would vary, as discarding affects ranks. This can be worked around by applying another pass of ranking (excluding NA's).
Missing values are imputed using the "Middle". Once everything above is done, one would impute any remaining NA feature cells with 0.5. If you were using ZScore, you would, of course, use 0.
Let me know if there's anything unclear in this explanation.
My intent was to disclose precisely how Target Information Regression is computed relative to what you did, in case that would reveal a means of improving its output or help the discussion.
I will think about it. But what I have showed you is pretty simple. A DataMiner download and 9 lines of code if you do not count what is commented out.
What is missing is my method of calculating excess returns below
And the fact that I used excess returns relative to a P123 benchmark not excess returns relative to the universe for Target Information Regression. There is a difference there.
If that is the difference, it might be good to make returns relative to the universe more easily available.
import pandas as pd

# Read the CSV file
df = pd.read_csv('~/Desktop/DataMiner/DM8.csv')

# Ensure that the "Date" column is a datetime object
df['Date'] = pd.to_datetime(df['Date'])

# Calculate the mean returns for each date
mean_returns = df.groupby('Date')['Future 1wkRet'].mean()

# Subtract the mean returns for each date from the individual returns
df['ExcessReturn'] = df.groupby('Date')['Future 1wkRet'].transform(lambda x: x - x.mean())

# Now, df['ExcessReturn'] contains the excess returns for each ticker and date
I am probably pretty good at describing what Target Information Regression should do. If I have a strength it would be that.
I don't immediately know on the code or the algorithm you describe. If it is not a difference in the calculation of excess returns you might start with your own DataMiner Download and see if it differs for you too or not. Then experiment with dealing with NAs in a different manner (similar to that of the DataMiner download to start). Or changing the rest of what you described above until the answers are the same or maybe even better than the DataMiner download.
It is possible that my code could be improve upon (if it is found to work for you).
I cannot do most of the above with regard to changing P123's Target Information Regression code to see if any changes improve the results. And I do not know ahead of time what you will get with your own DataMiner downloads starting with my code and maybe improving my code if (and only if) it works for you.
Hi Jim.
I did a test where I downloaded the data directly from the AI Factor load page and ran mutual_info_regression using that data. The results were very close to what was shown on the Feature Stats page. The results change slightly every time you run mutual_info_regression, so I was not expecting to match it exactly.
Now I want to do a test similar to yours but I want to retrieve the data exactly the same way you did. When you downloaded the data using Dataminer, I assume you were using FRank() for every feature. Did you include any parameters besides the formula? For example would you use just FRank("formula") or something like FRank("formula",#All,#Asc) where you set the sort for each feature based on your experience? Did you set the incl_na param?
I do not think this was a final copy of the code I used but probably not a lot of modifications. Here is at least an early version of the code I used in DataMiner. I am sure I used an existing ranking system and this is pretty close at least: