Whycliffes -
The Unemployment Rate has historically been a highly accurate indicator for the start of bear markets. However, there is a crucial problem with using it as a timing indicator.
Logically, when small businesses (collectively, the US’s largest employer) begin to see a significant decline in traffic/sales, they usually cut the cost of their traditionally most significant expense first. They can’t do anything about their sunk cost for plant/equipment or commitments like rent (think of a restaurant or retail business), but they will lay off employees who aren’t needed when the customer base shrinks. Employees are usually the first thing to go. Therefore, historically, a rise in the unemployment rate has been highly correlated to declines in GDP - i.e., the start of a recession.
Likewise, equity investors are especially sensitive to economic contractions, which have historically caused a correlated earnings and stock price contraction. Hence, a significant rise in the Unemployment Rate is highly correlated to stock-price declines. An increase of 0.5% above a low is used because it helps investors discriminate between random noise and meaningful signals.
HOWEVER, for the first time since Unemployment statistics began being tracked in 1948, the Unemployment Rate in February-March 2020 WAS NOT an accurate signal for the beginning of a bear market. It failed in 2020 partly because of the idiosyncratic nature of the Covid Pandemic and partly because the Unemployment series lagged the market so much last year.
Regarding the Unemployment Rate being an effective timing tool, it’s clear it has been effective historically because economic contractions have always been a progressive, cumulative series of events that results in the deterioration of the economy and corporate earnings. One factor after another begins to turn south, we can usually see the progression of negative influences building up. Finally, there is a point of support that cracks and the dam breaks.
For example, in the ‘Financial Crisis’ recession, we saw negative market factors growing through all of 2007 as the pressures in the housing market piled up. Breadth measures such as the Advance-Decline Line turned down months before the market did. Moreover, the S&P 500 high occurred on October 10, 2007, but the actual decline didn’t start for two more months, and it took 18 months for stocks to find a bottom.
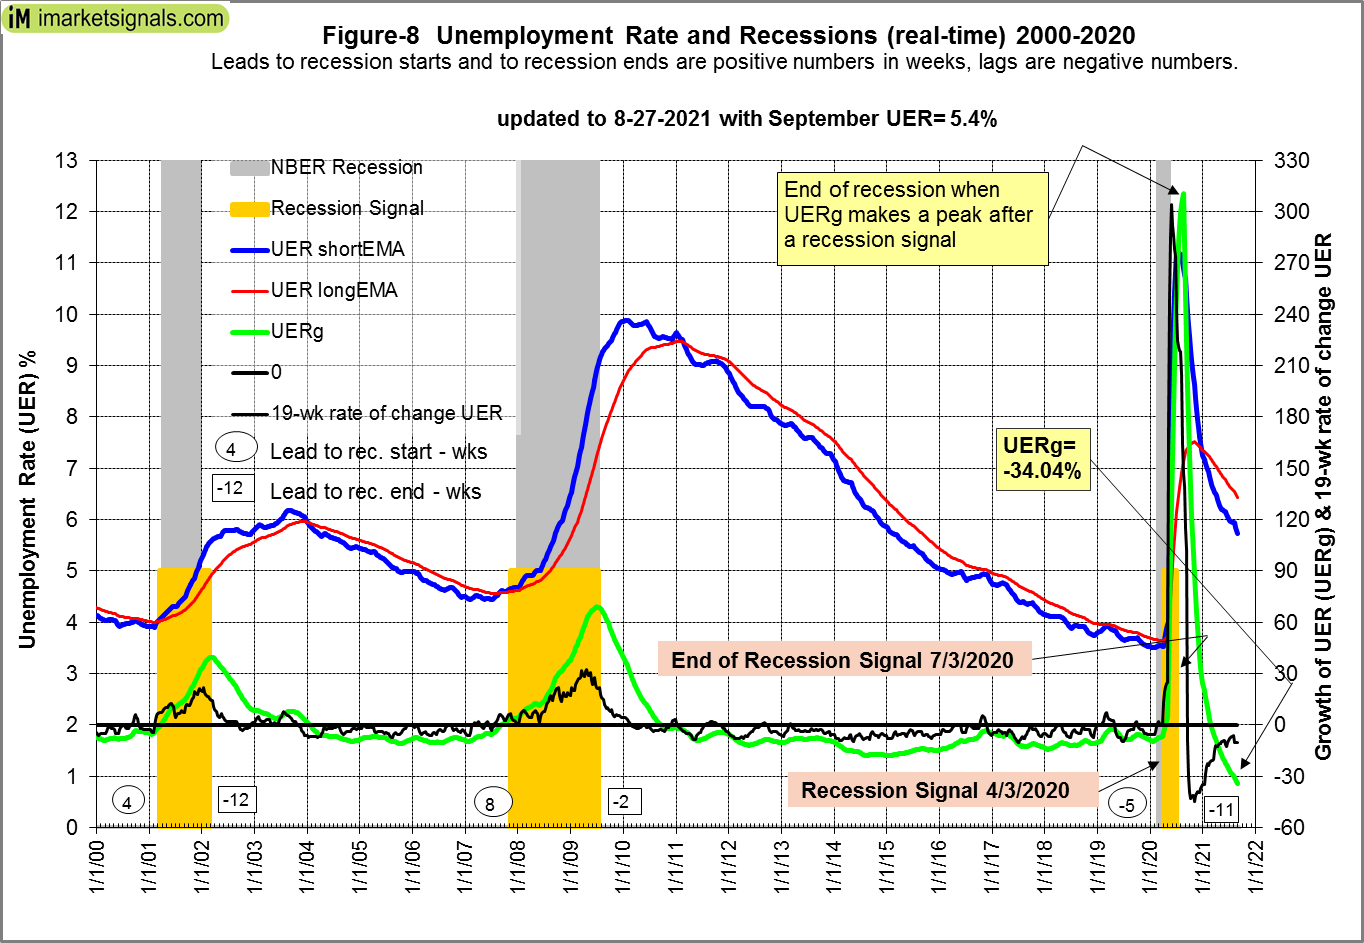
In the Covid Crash, the market’s decline began on February 24, 2020, but the Unemployment Rate was still at 4.40% (considered ‘Full Employment’) at the March 6, 2020 labor report for February. Since we don’t get updates of the prior month’s Unemployment Rate until the first Friday of every month, that data series is seriously lagging in an event like the pandemic. Worse, we then apply a threshold (based on past prices) to generate a signal, making it lag even more. By the April 3 report, Unemployment in March had skyrocketed to 14.8%, and more than 20 million Americans were out of work.
As you can see from this chart, stocks had already begun to climb higher and were in a powerful rally when the Unemployment Sets turned downward:

As a result, the Claudia Sahm timing you highlighted was a terrible indicator in 2020. You can see from this Custom Series that the market was already in a powerful uptrend when the timing system went to cash in 2020:

You would have been required to absorb ALL of the -34% selloff in March 2020, and exited your positions while in the rally off the bottom. Also, the signal performed in a less than stellar manner in 2001, exiting the market when the dot-com crash was more than halfway over.
When you combine BOTH the Unemployment Indicator AND the 200-day Moving Average (which is also a very lagging indicator), you have the ultimate system to make you regret ever hearing the name Claudia Sahn! haha
There are far better risk-assessment and avoidance signals that are available to you on P123. For example, here are the signals for one of many indicators that I use:

If you followed this signal alone, you would exit in a timely manner just before this risk indicator increased over a certain threshold and re-enter the market just after a rally begins. It has some whipsaws, but when combined with several other uncorrelated indicators from the [color=blue]50+ Indicators[/color] I use on my site, those whipsaws are virtually eliminated.
It will take time, but you’ll get the hang of it after a lot of trial and error – and continue doing what you’re doing: Think outside the box and ask questions. Best of luck!