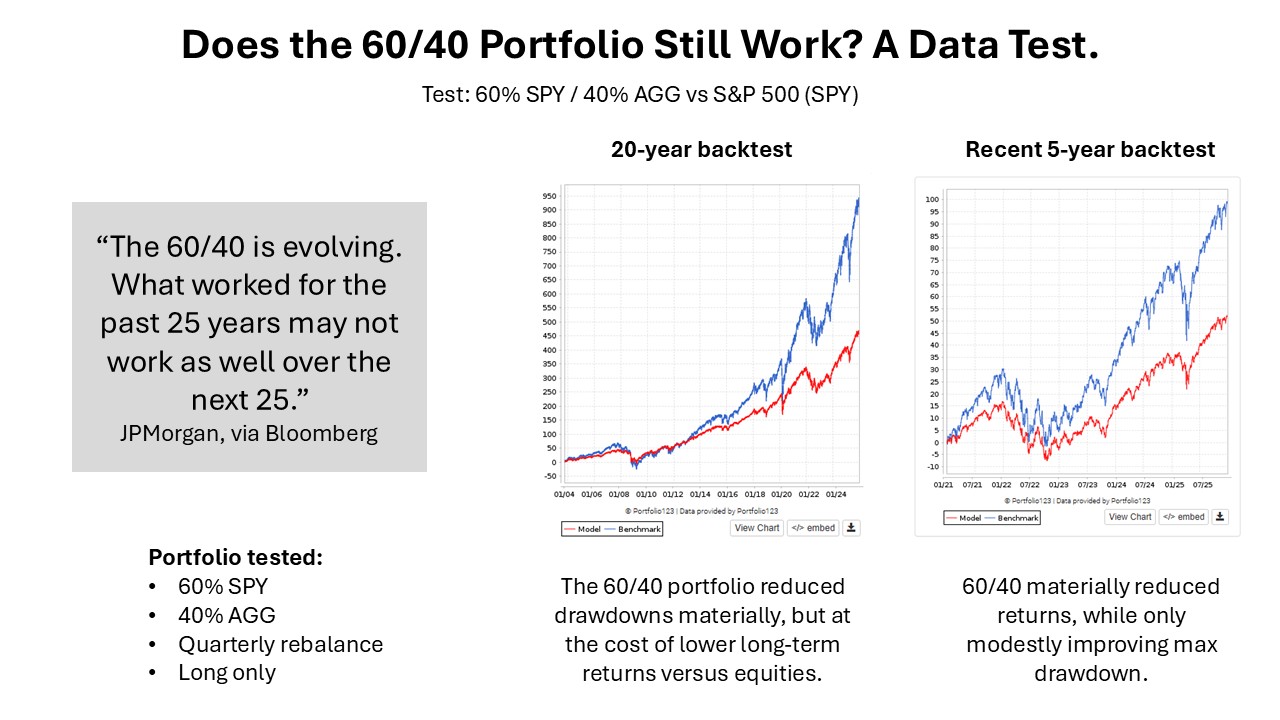
Over the full 20+ year history, the results explain why 60/40 became the default allocation:
Meaningfully lower volatility and drawdowns versus 100% equities
Lower long-term returns due to reduced equity exposure
This period benefited from strong equity returns and a long secular decline in interest rates, which helped bonds act as an effective diversifier.
Last 5 years (stress test)
Focusing on the most recent 5 years tells a more nuanced story:
Returns lagged equities materially
Max drawdown improved only modestly
(~-20.8% for 60/40 vs ~-24.8% for SPY)
Bonds still provided some drawdown mitigation, but the diversification benefit was much weaker during an inflation and rate-hike driven regime, and came with a significant return drag.
The takeaway is not that 60/40 is broken, but that diversification is regime-dependent.
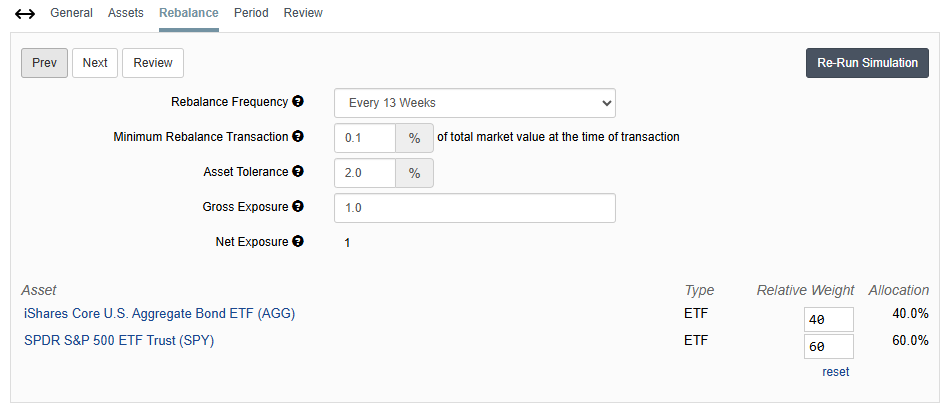
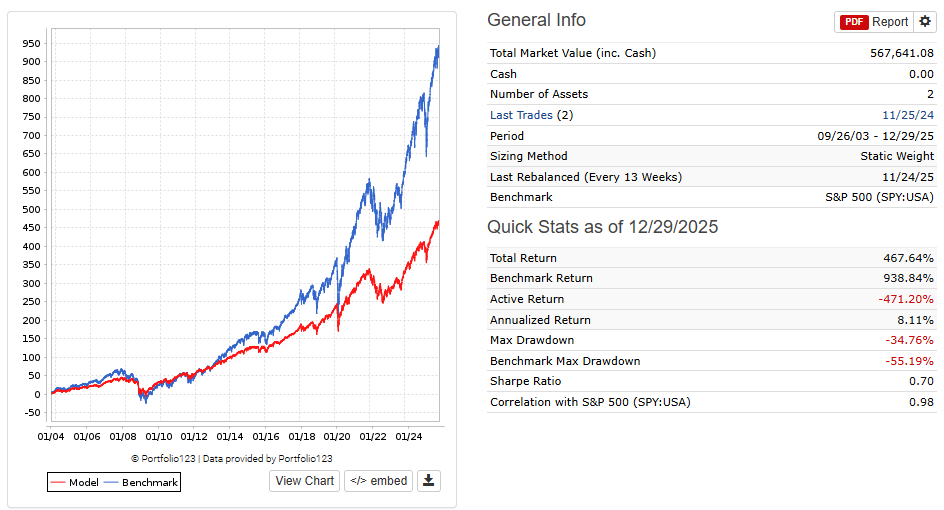
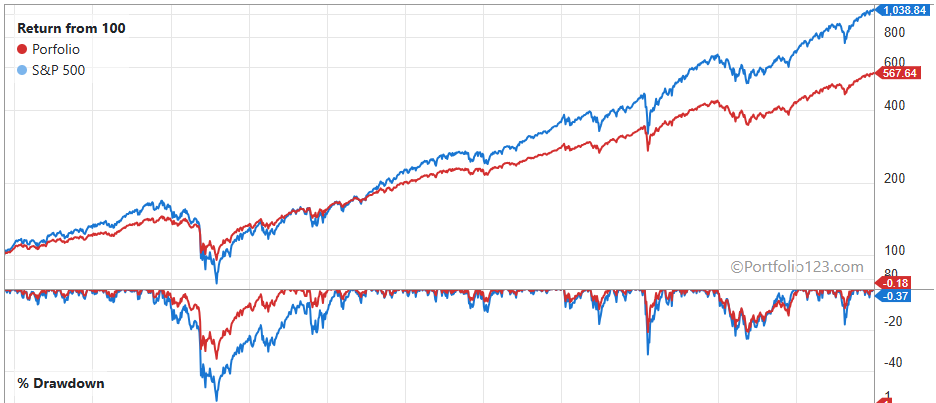
This is exactly why it’s important to test allocations as full portfolio books, across multiple timeframes, with complete return, drawdown, and correlation metrics rather than relying on long-term averages or rules of thumb.
I’ve attached a screenshot of the book setup and the full performance stats for anyone who wants to replicate or extend the test (e.g., different bond duration, rebalance frequency, or additional sleeves).
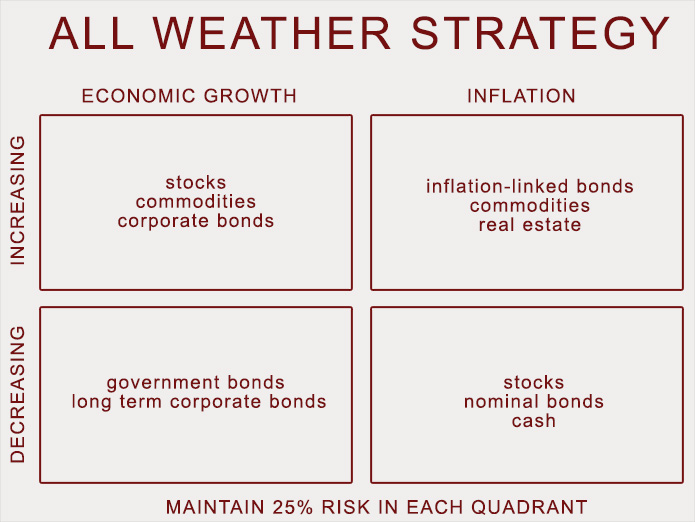
Dan Rasmussen has a nice matrix of economic regimes and asset classes that work best in each regime. from memory - I think it is:
Q1 rising growth + Disinflation = Stocks + corporate bonds (from 80s to 2020 pretty much)
Q2 growth + reflation = commodities + stocks. long bonds negative. stick to shorter duration
Q3 slowing growth + rising inflation = Commodities, esp gold.
Q4 slowing growth + falling inflation = Long bonds
if any of you have an idea on how to simulate this - I would be interested. In fact, do we have access to growth and inflation series?
Yes, the FRED data. Asset performance is regime dependent and therefore, so is the utility of diversification and asset allocation in general into any given investment class.
For example, hyperinflation or even just high unexpected inflation can wreak havoc on fixed income. Lower than expected growth on the other hand can wreak havoc in many stocks but benefits fixed income (unless credit risk spikes) if inflation is expected to come tumbling down. I disagree with one item (LT corporate bonds) but here is a diagram:
I learned about some of it when I read The Alchemy of Finance back in 2007 or 2008 and similar ideas help shape my macro and hedging framework specially now that I have studied economics. These basic concepts helped make Bridgewater the giant it is today. I think past performance (all-weather) has been somewhere in between both approaches (closer to bond +stock than to pure stocks) but it is not meant to outperform them but to gain consistently and avoid large losses. Whether it outperforms depends a bit on how many credit crises you get and how many unexpectedly high inflation periods you get. You cannot extrapolate the past either way.
Of course if one can consistently predict which one, two or even three quadrants are most likely to play out one can further improve on it but it is easier said than done specially with no economics background. For me the key thing is understanding the economics/drivers of it rather than trying to find a perfect mix to backtest whereas the risk parity approach is more about using a fixed risk mix
This approach was originally developed by Ray Dalio and Bridgewater Associates as part of what later became known as All Weather.
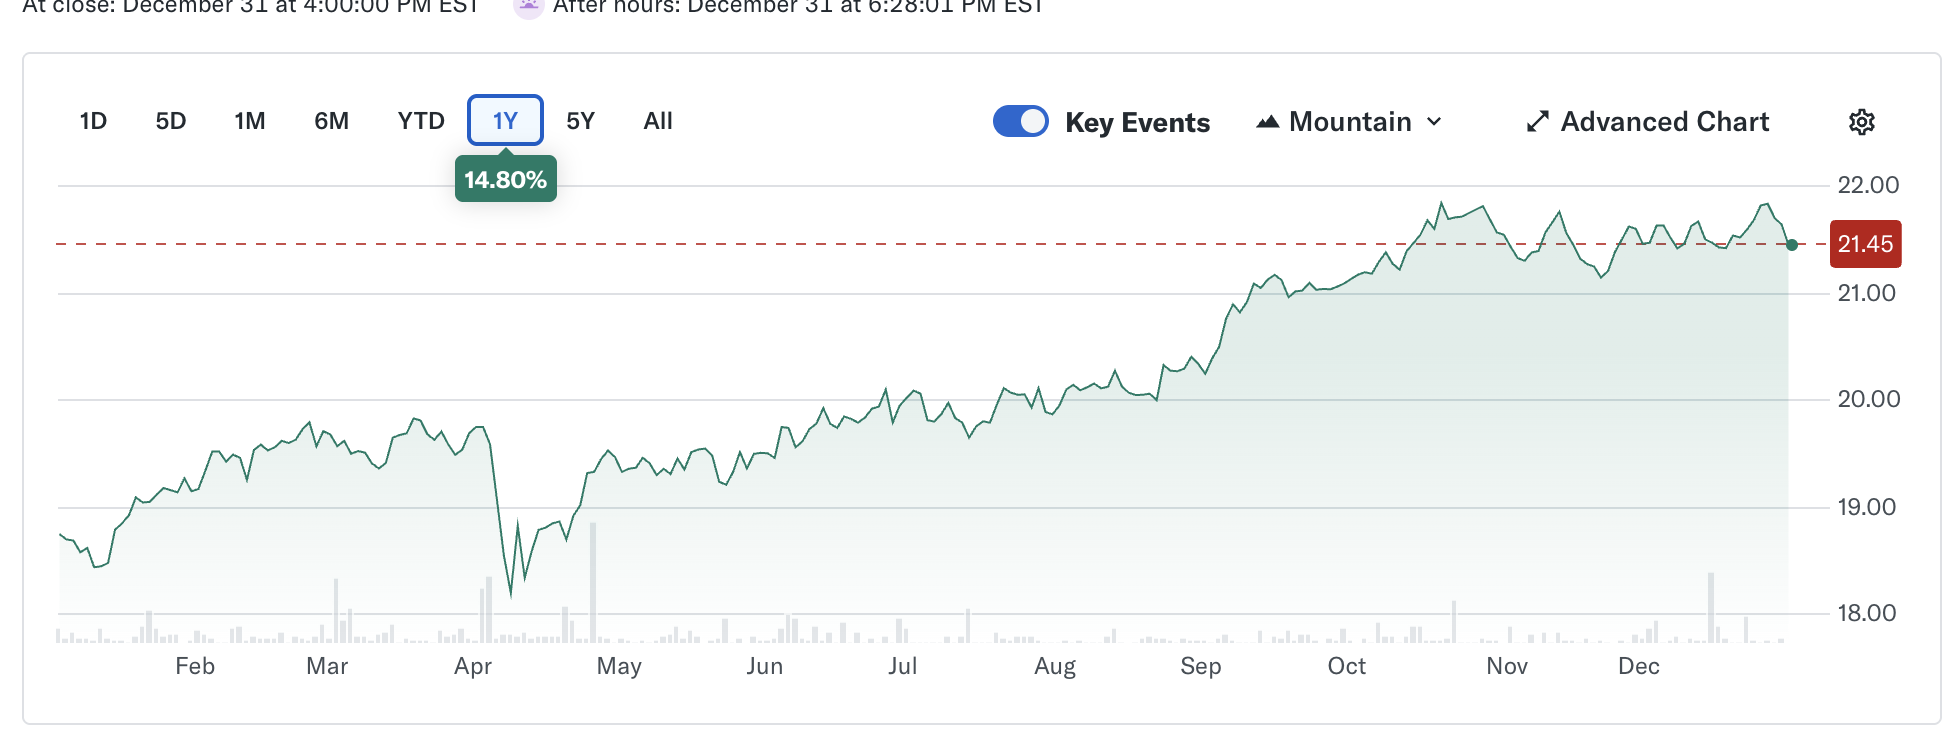
Some of the former staff of Bridgewater Associates left and developed their own All Weather Funds sticking to this strategy. Here is their leveraged version. It has done okay recently but when the interest rates were near zero the bond portion suffered: The last year of RPAR from Yahoo: