I was wondering whether anyone uses histograms of returns like the one below as an indicator of possible out-of-sample performance, and if so, how. What do you look for, and what measures have you found useful?
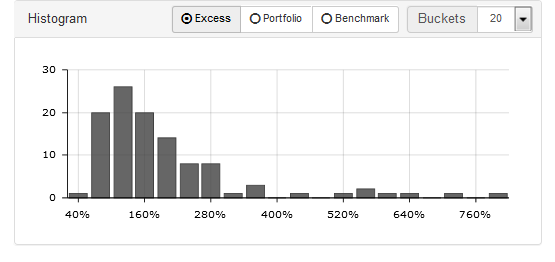
I was wondering whether anyone uses histograms of returns like the one below as an indicator of possible out-of-sample performance, and if so, how. What do you look for, and what measures have you found useful?
I use the rolling test tool to measure number of instances of negative excess returns and negative portfolio returns. I do it for all of my ports. I use 1-5 year periods with one week increments. It helps set my expectations on the probability of negative results for the different holding periods (total number of negative instances divided by total samples). It has been quite good, for the ports that I have been running for several years already, at showing the possibility that the port my not keep up.
I also use it to compare ports.
From my experience, the stronger the annual performance, the fewer the negative rolling instances, which I think makes sense.
I don’t look so much at the skewness or kurtosis characteristics. Just negative returns.
How would one use a histogram to predict out of sample performance? By definition, if it’s in the data, it’s also in the sample.
I actually like to compare cumulative distributions of rolling tests visually looking for stochastic dominance.
The only way I use the rolling test is to see the probability of underperforming the index. I measure 1,2 and 3 year increments and then I look at the % of times the method underperforms in any given time frame. I generally expect to have close to 0% probability of underpforming the index over 3 years for it to be a decent simulation.
Well, if your histogram is a normal distribution, some people think that the Sharpe ratio or information ratio will predict out-of-sample performance. Both of these take the mean and divide by the standard deviation, which, in a histogram with normal distribution, would be the midpoint divided by a certain portion of the range.
But most of the histograms we get are not normally distributed. In that case, some people use the Omega ratio as a performance measure (this takes an acceptable return and measures the area under the curve to the right of it and divides it by the area to the left). Others have used a formula that combines the mean, the standard deviation, the skewness, and the kurtosis (though I don’t know what that formula is). This is the kind of thing I’d like to know more about.
I use the median excess return–the point on the histogram that has an equal area to the right and left–to predict out-of-sample performance, as it’s the measure that has worked best in my correlation studies. But I was wondering if there’s a more sophisticated measure, one that would incorporate more information that the histogram provides. The omega ratio is something I want to look into further.
Yuval,
I see.
This link may be of interest: https://quant.stackexchange.com/questions/16611/here-is-an-approach-for-measuring-data-snooping-is-it-new
Basically, the author proposes excess kurtosis as a measure for sensitivity to outliers. The means of highly leptokurtotic distributions depend on large wins and losses which may be one off events vice repeatable outcomes. A similar result can be had by trimming/winsorizing the distribution.
You may also want to talk to Jim Rinne about bootstrapping confidence intervals which is basically reconstructing the histogram in a bunch of different ways.
I would hazard though that no statistical test for out of sample performance can replace data which is truly held out of sample (I.e., the model was built in ignorance of this data).
A rolling test will count the same period more than once. For example, the worse month of 2008 could get counted 36 times in a 3 year rolling test (more or less depending on your settings but not just once). So, not “independent” and not a true mean or median of your returns.
I like it for finding extremes.
I had a chance to try out the omega ratio. It’s quite complicated, and I don’t know if I’m calculating it correctly, but it seems to work better in terms of correlating with future performance than any other performance measure I’ve tried, including alpha, median excess returns, CAGR, Sharpe ratio, and information ratio.
Here’s an excellent explanation of the ratio by its creators:
http://www.all-in-or-out.com/An%20Introduction%20to%20Omega.pdf
Basically, the omega ratio is defined as the area OVER the cumulative distribution function to the right of a minimum acceptable return divided by the area UNDER it to the left of that return. The cumulative distribution curve is quite different from a histogram, in that it counts the instances of all returns lower or equal to every point, so it looks a bit like an S.
This is a rather difficult ratio to calculate. But the IDEA behind the omega ratio is a good one: “the probability weighted ratio of gains versus losses for a given minimum acceptable return.” By moving the minimal acceptable return to the right and left, you can get a series of numbers that reflect the entire distribution. Which is better than the one-number snapshot that the median excess return gives.
Now someone–I can’t figure out who–posited on the Internet an alternative way to calculate the omega ratio, derived from the appendix to this paper:
http://www.edge-fund.com/KaSG03.pdf
Basically, you take all the monthly returns, subtract your minimum acceptable return, sum up the positive results, and divide by the negative of the sum of the negative results. Now my gut tells me that this is NOT equivalent to using the areas over and under the cumulative distribution curve. But since I don’t understand the appendix of that paper, maybe I’m wrong. If someone reading this can help me out here, I’d really appreciate it. In other words, does the appendix to this paper, which refers to European put and call prices, support the idea that these two methods are equivalent? Or is it far more complicated than that?
At any rate, the way I’m now doing it is simple and elegant, and it works. I figure out this modified omega ratio using three different minimal acceptable return points, average them, and get a performance measure that’s more complete and more predictive than any other I’ve tried.
The advantage this has over median excess performance measures, which is what I’ve been using for the past few months, is that it takes a lot more moments into account. The advantage it has over alpha, the Sharpe ratio, the information ratio, etc. is that it’s free of OLS distortions, which give too much weight to outliers and don’t work very well on non-normal distribution curves.
The disadvantage of the omega ratio is that it doesn’t take into account the benchmark, and if you use benchmark returns as your minimum acceptable return, the results are not as good.
I still have a lot of experimenting to do, but it looks promising so far.
If I remember correctly that last derivation of the omega ratio is just the Pain to Gain ratio ala Jack Schwager (Market Wizards guy)
Indeed, you’re right, it is. I hadn’t been aware of the Pain to Gain ratio before, so thanks. The big difference is that Schwager just uses 0 as his minimal acceptable return rather than looking at several other points as well. I’ve found that using the median benchmark return is the best.
I also figured out that the two formulae for the Omega ratio are indeed equivalent, as Schwager acknowledges.