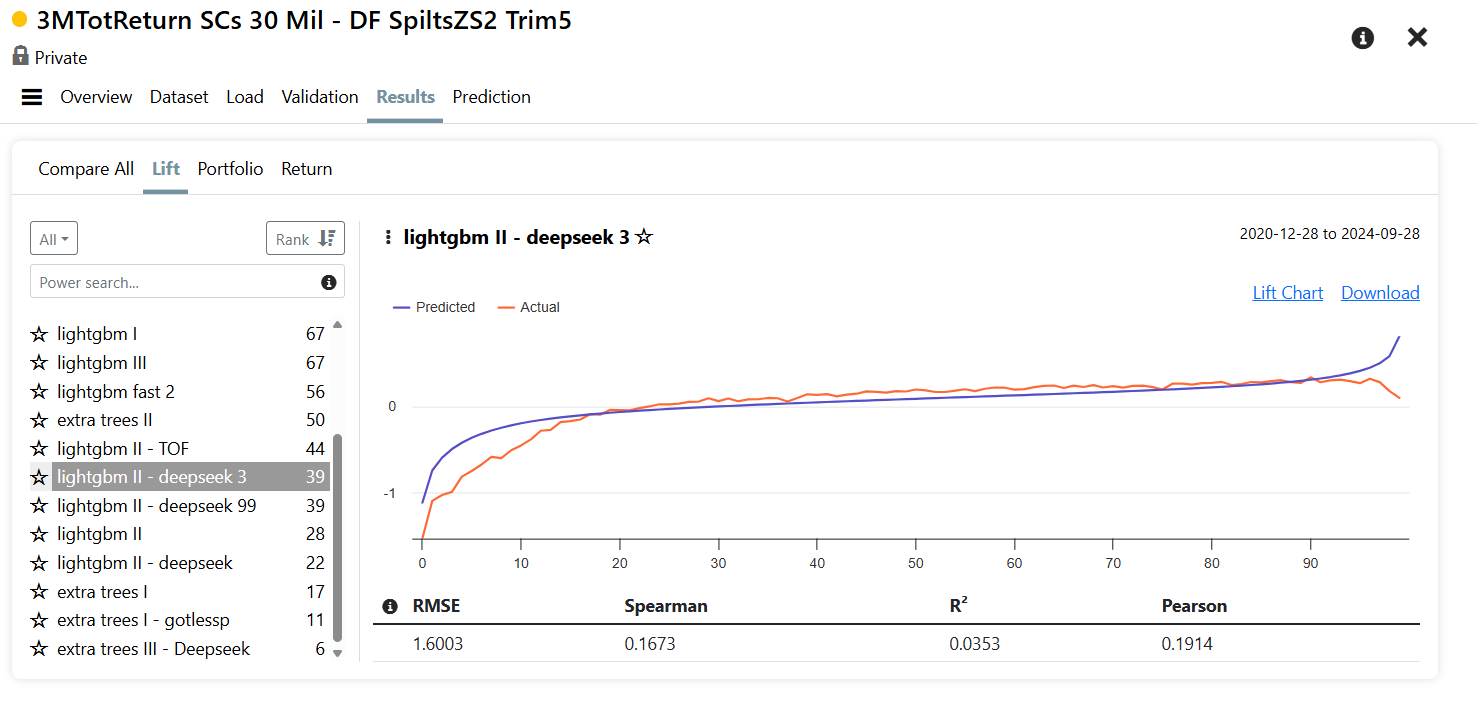
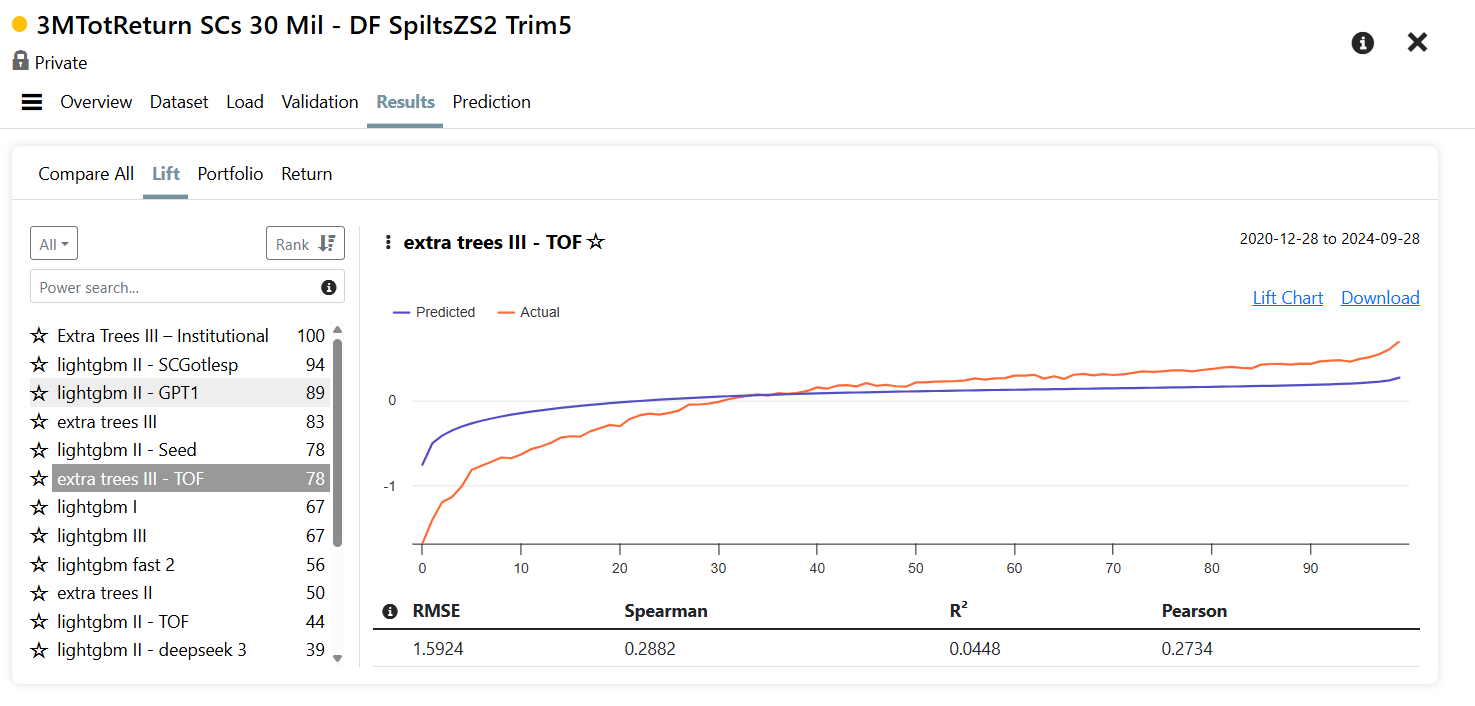
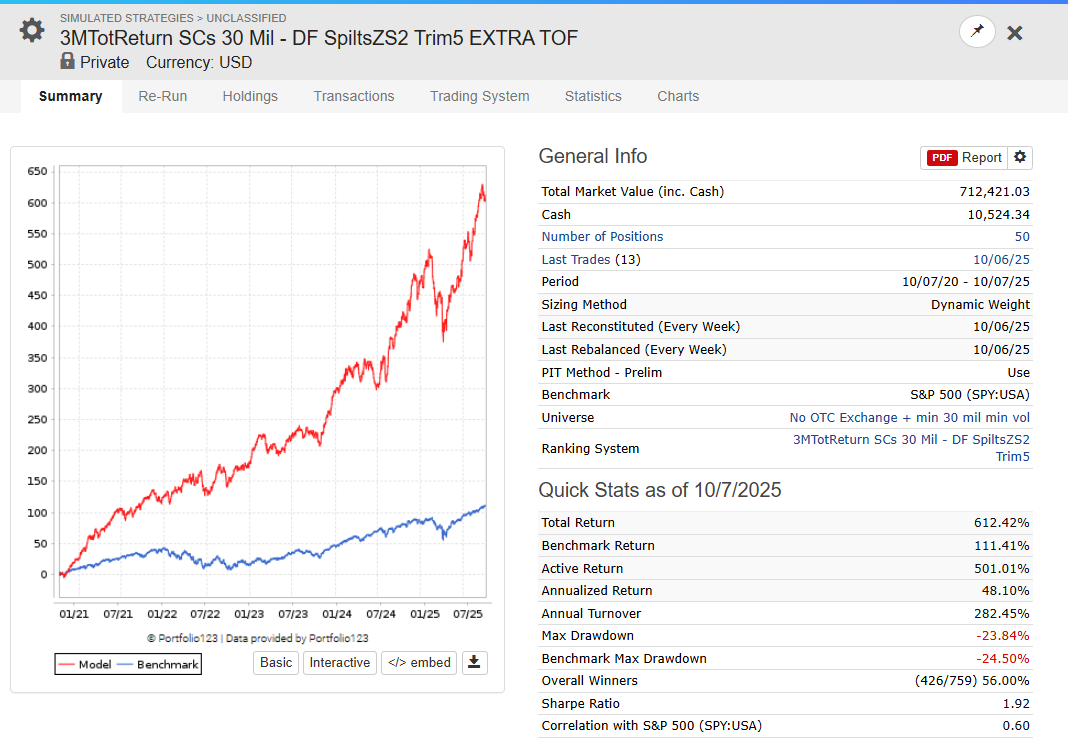
Hi fellow P123 members. I have been doing a series of lightgbm tests these last few weeks in a dataset with no N/As and have found a couple interesting things for my dataset I would like to share and get users’ thoughts, and color regarding what everyone has been observing.
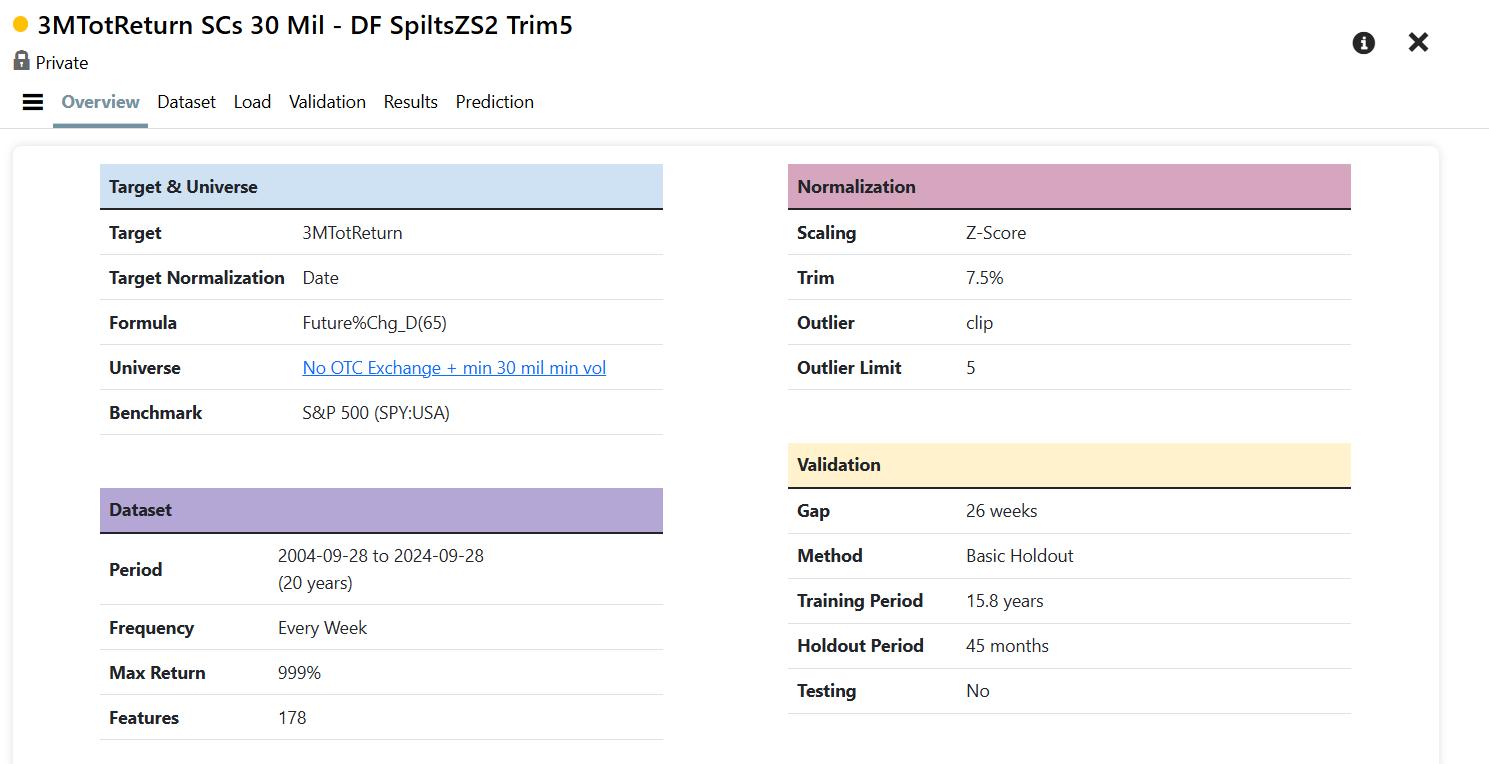
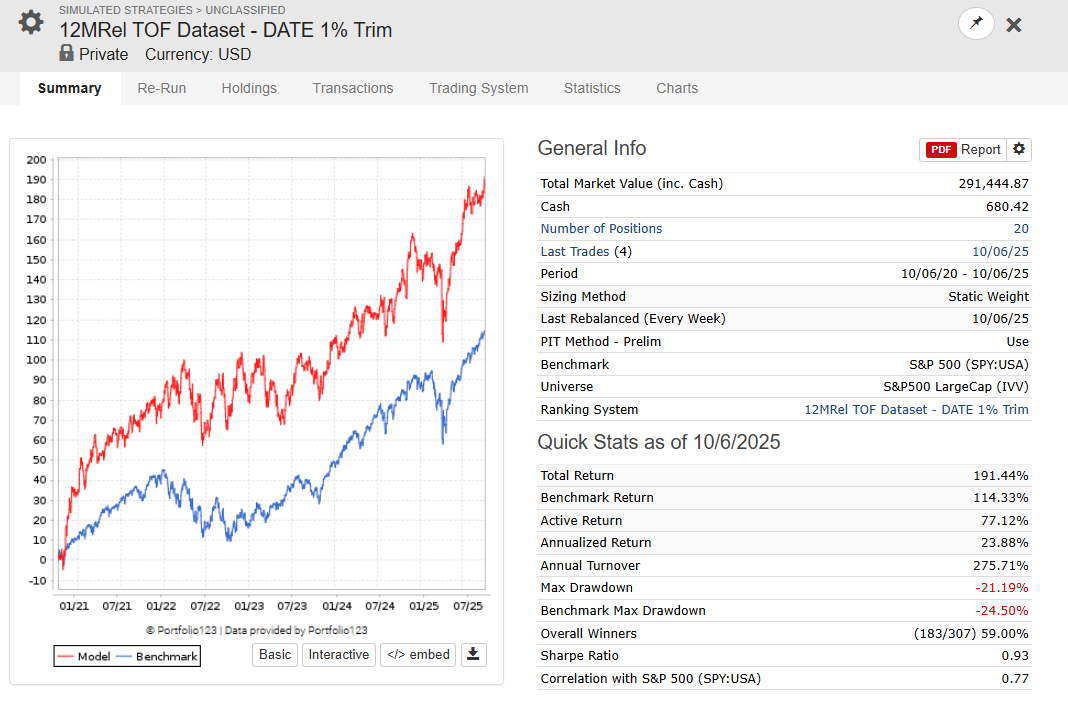
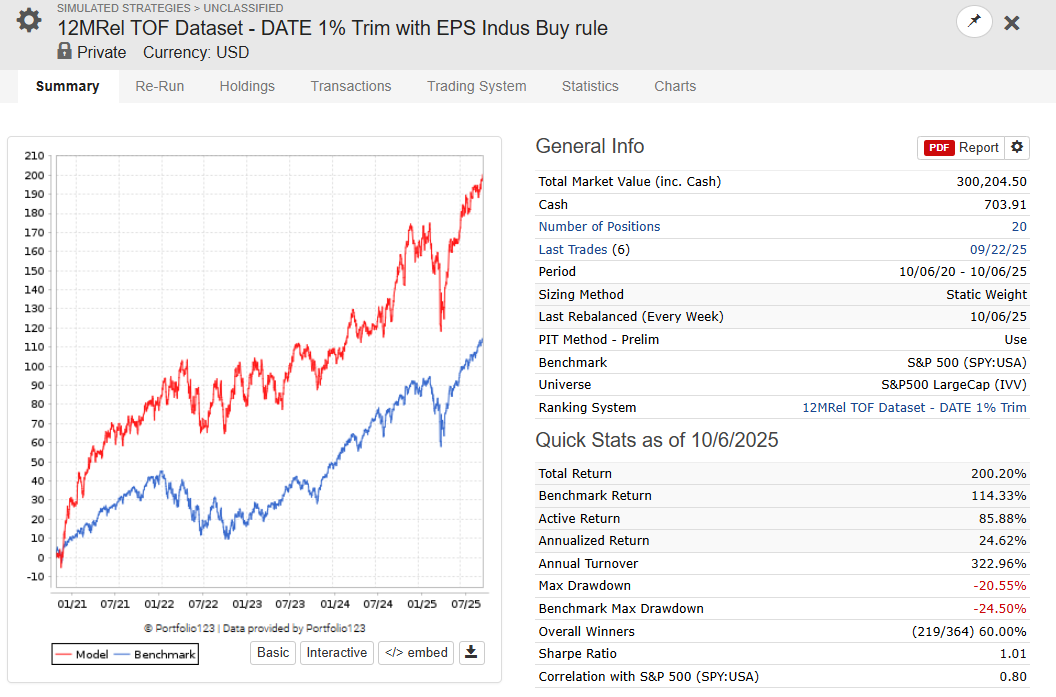
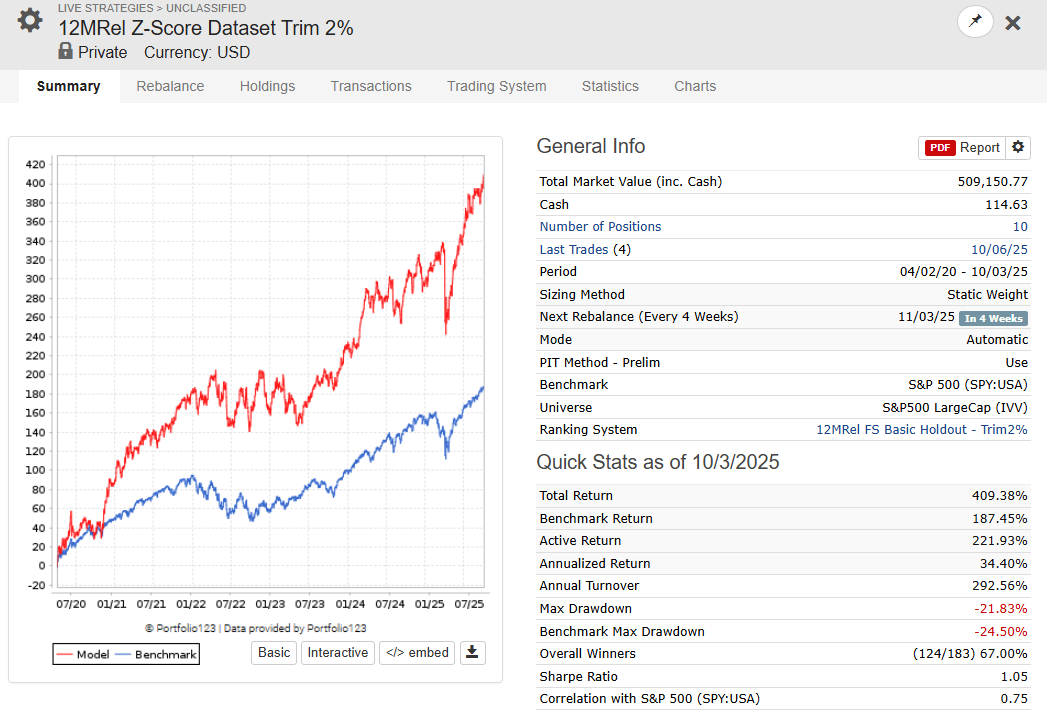
For my features and dataset, the higher the trim, the lower my return at least for a number of tries from 0 to 5%
-The higher the trim, the lower the return as the model loses information
-Additionally, the higher the outlier setting the better the return as the model gains information here as well.
This makes intuitive sense, but makes me want to compare and contrast with other’s experiences as I have read of higher trims being used in general. Do we think it is likely highly dependent on the amount of N/As in your key data?
I haven’t looked at this recently, but in the past when I tried to determine whether outliers were a problem, I didn’t find any benefit from trimming, Winsorizing, or using Huber loss—at least not for tree-based models.
What did seem to help was increasing the minimum leaf size. Larger minimum leaf sizes seem to dilute the effect of outliers, and that may be why I’ve never seen outlier handling make a difference: the larger leaf size might already be managing the issue.
For linear regression it may be different. The impact of an outlier depends heavily on its leverage—where it occurs relative to the other data points. That makes generalizations about outliers in linear models more difficult. I am not as sure about linear models.
Thanks Andreas. Does make me wonder why trim and outlier settings can behave differently (differently than the lower the trim the better) in some models and I am suspecting it is because of the number of NA creating many zeros and swaying the distribution.
Perhaps the best way to handle the NA would be to exclude from the distribution or set them equal to the mean excluding the NAs (where they are most likely to be drowned by more data), not sure. Distributing them randomly in the shape of that factor’s distribution could be even better.
Lots to study in my case as well and thanks for sharing- your writings on which settings you have found useful have been very helpful
I should say I was using a minimum leaf size of 50, at least for MSE so that is a factor too. Good to hear you have also not found a benefit in trimming
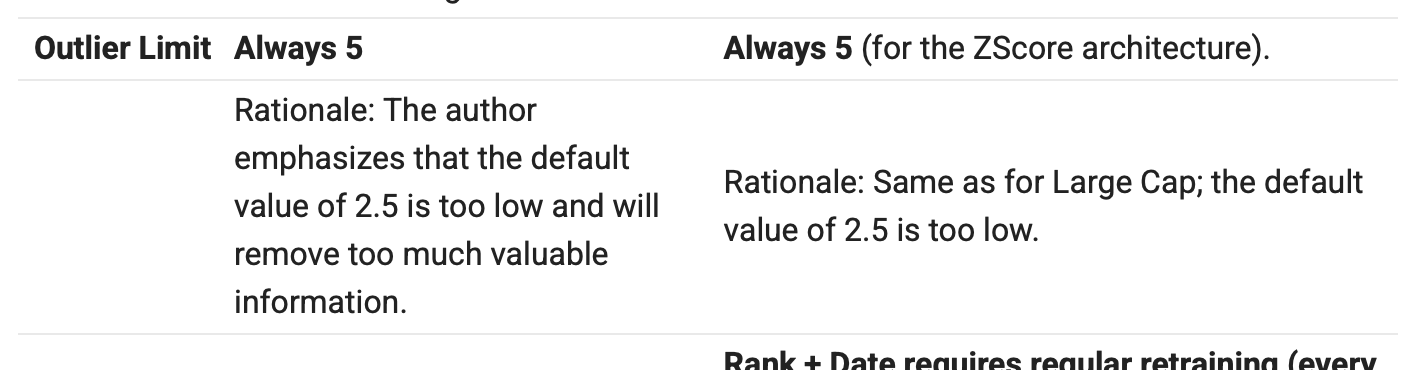
I stablish it at 5. At 2 for example with different universes and test it behaviour was worst. Trim still playing. I have some NA in play however. skip + dataset config
Regarding NA on features maybe some of them now have info and, in the data some years ago it doesn't fetch it or it was not available…I need to dig into but it s just a supposition or thought . Of course if the level is high I obliterate it
Update: Looks like NA are grouped into the mean rather than using a raw zero then normalizing. They are added after normalization as a zero (zero std away). Basically, an attempt to replicate n/a neutral in traditional models. Could create issues for features where the mean is good, but i think this is probably the right choice for now as it could create larger issues elsewhere.
Interesting. Outliers kicking in-specially in gbm. Thanks for sharing. To give more details of the universe I was using I was using basically everything above 100,000 total traded or 50,000 in my tests. The large count must be drawning some of the aberrations whereas in large caps theres less aberrations to begin with.
The amount of trim to use very much depends on which hyperparamters and algorithm you are using. LightGBM is more prone to overfitting than extratrees. Also, if you are analyzing SP500 stocks you probably need hardly any trim, eastern eruropean stock probably require way more trim.
@judgetrade, with LightGBM and small/microcap, add some regulation and randomization with reg_alpha, reg_lambda and bagging_freq (with extratrees). The trim will matter less with those adjustments.
Trim and z-score cutoff are not separate. You will need to optimize them together won’t you?
Adjusting trim changes the standard deviation for the z-score calculation used by P123. It is done as a 2 step process at P123.
Not sure that you can do a grid-search here, but if you were to do it you would optimize a grid-search using BOTH parameters at the same time. Not one then the other as adjusting the trim will affect your first z-score cutoff optimization, if you do it sequentially.
If you increase the trim you will have a higher standard deviation for the z-score calculation. The z-score will calculate smaller for the same set of data. The z-score will then need to be adjusted. You could do it sequentially but grid-search does that for you..
If you are doing this with P123 I think that is the case. .
I am now using no trim and not cutoff (just max/5) will probably try dealing with outliers in different ways rather than artificial cutoffs in the data. Maybe will use a very low trim in situations were data is suspect like penny stocks but nothing extreme. For my data (very clean data) it seems to hurt anyways.
 . Of course if the level is high I obliterate it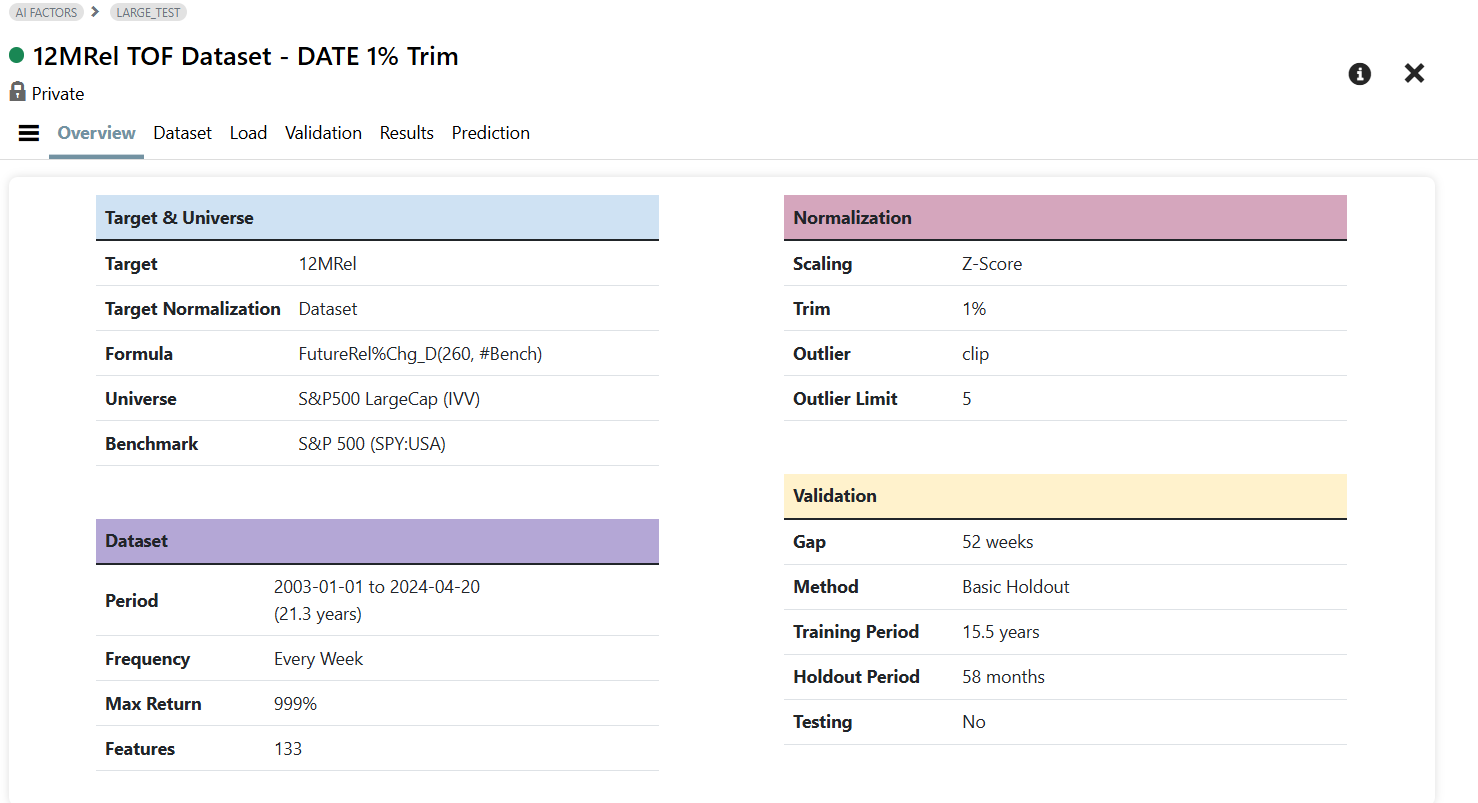
 Just remember me when you inevitably become a multi-billionaire