I’m currently using a Python script (using LightGBM and CMA-ES) to optimize factor weights for a ranking system. I have a total simulation budget of roughly 3,000 simulations available for each test.
I am splitting my data into 3 distinct sub-universes (), and I am debating between two different architectural approaches. I would love to hear any thoughts on which approach you think would yield better Out-of-Sample (OOS) performance.
Process: I run a single optimization job that targets all 3 sub-universes simultaneously.
Budget: The optimizer runs ~1,000 iterations, but in every single iteration, it simulates the current factor weights against all three sub-universes.
Objective Function: The fitness score is calculated as the average performance (CAGR) across the three universes in each simulation run.
Result: I end up with one single ranking system that works "moderately well" across all three universes.
Hypothesis: This acts as a form of cross-validation during training. Factors that work in Sub-universe A but fail in Sub-universe B are penalized and discarded. The backtest stats are lower, but the logic should theoretically be more robust and fundamental.
My Question:
Given a fixed simulation budget, which approach do you think would be more reliable for live trading? A ore B?
I think that approach A would give you the best estimate of out-of-sample performance as it closely matches traditional ML cross-validation approaches. Whatever your optimization method is should include some kind of regularization to avoid overfitting. Once you use approach A to validate the performance, you could then use the same training method on the entire universe and that ends up being your final ranking system.
In fact, as you mention, approach B could essentially serve as a regularization technique, so you could nest approach B inside of approach A, although I don’t know how you would achieve this in P123. In this way you would split each of your 3 sub universes into another 3 sub universes, and use approach B on those to optimize the ranking system. This mimics K-Fold cross validation where you split each outer training fold into a further inner set of folds for hyperparameter optimization, etc.
Do option A. But add a little extra something. Find the ranking systems with the best median results across all three universes and average those in too, maybe giving those equal weight or a little more with the winners of the three universes. Keep the universes separate, as option A describes, but if you keep track of all the scores, you can find a ranking system or two that works pretty well on all three. And also remember that statistical ties are going to be common with this many iterations. Don't discard a ranking system just because it's close. Lastly, don't overoptimize.
In practice, small differences between ranking systems are going to be irrelevant to the out-of-sample outcome.
What would be the simplest way to merge these three different ranking systems?
Create three composite folders and give them 33% weight each? This would likely result in several identical criteria within each of the three composite folders. This is very simple, but could then lead to over 100 (x3) stock criteria in each composite folder, which in turn gives over 300 criteria in total, which often makes the simulation a bit slow.
I have sometimes asked AI (Gemini or Claude) to go through the three systems, normalize the weights in each of them first, then sum together identical criteria, and keep all other criteria as they originally were in ranking system A, B, or C. Then you end up with one system, but I notice that sometimes the AI takes liberties and forgets some criteria, and there are some rounds back and forth before I am sure that it has done the task I asked for.
Why do you use the average instead of summing them together? I would think that when there are two identical criteria in different ranking systems, it signals that this is a strong criteria, so summing the weights of the two criteria would be better. Or?
It's the same. Let's say you only have 5 nodes in your ranking systems. In one universe the optimal combo is 0%, 20%, 40%, 20%, 20%, and in the other it's 10%, 10%, 20%, 50%, 10%. Whether you add them together or average them, you'll still get 5%, 15%, 30%, 35%, 15%, because they have to be rounded down to 100% at the end.
I have, when constructing ranking systems, typically run thousands of combinations of different criteria within these systems. Mostly based on these combinations, I have arrived at an optimal collection of criteria for a ranking system. Then, I rerun this process about 5 times from scratch. This is to ensure that a single round with many simulations and various criteria combinations isn't overfitting or flawed, or heavily dependent on a few stocks for its returns.
Subsequently, I have usually merged the top 5 existing ranking systems, as Yuval has described here, and others in several other posts on the forum. This has almost always resulted in a better Sharpe ratio, and when I stress-test this merged system, it often holds up well. Until now, I have mostly done this with small caps in the EU, US, and Canada. However, I then did the same process with large-cap global Custom Universes - Portfolio123. Custom Universes - Portfolio123
But for some reason, it didn't work then, and I don't understand why. I have reviewed the system several times to check if it's incorporating entirely wrong criteria. Anyway, everything seems to be working, but then the question arises: why doesn't this fusion approach work as well with large caps? Are there any obvious answers here that I am missing? I know it is more challenging to create good systems with large caps, but I am a bit surprised by the result. Is there a reason this fusion approach doesn't work for large caps, and what have you guys done, if anything, when creating ranking systems for large caps compared to those you have created for micro and small caps?
My experience is that there is a large size premium in the US, and a very small premium ex-US. Or maybe the optimal set of factors/weights varies with size in the US and less so ex-US. This has made me give up making an Atlantic system, and I instead build separate systems for the US/ex-US.
Though my impression from the forums is that some people are still able to build good all-cap system for the US, so perhaps it's just a "skill issue".
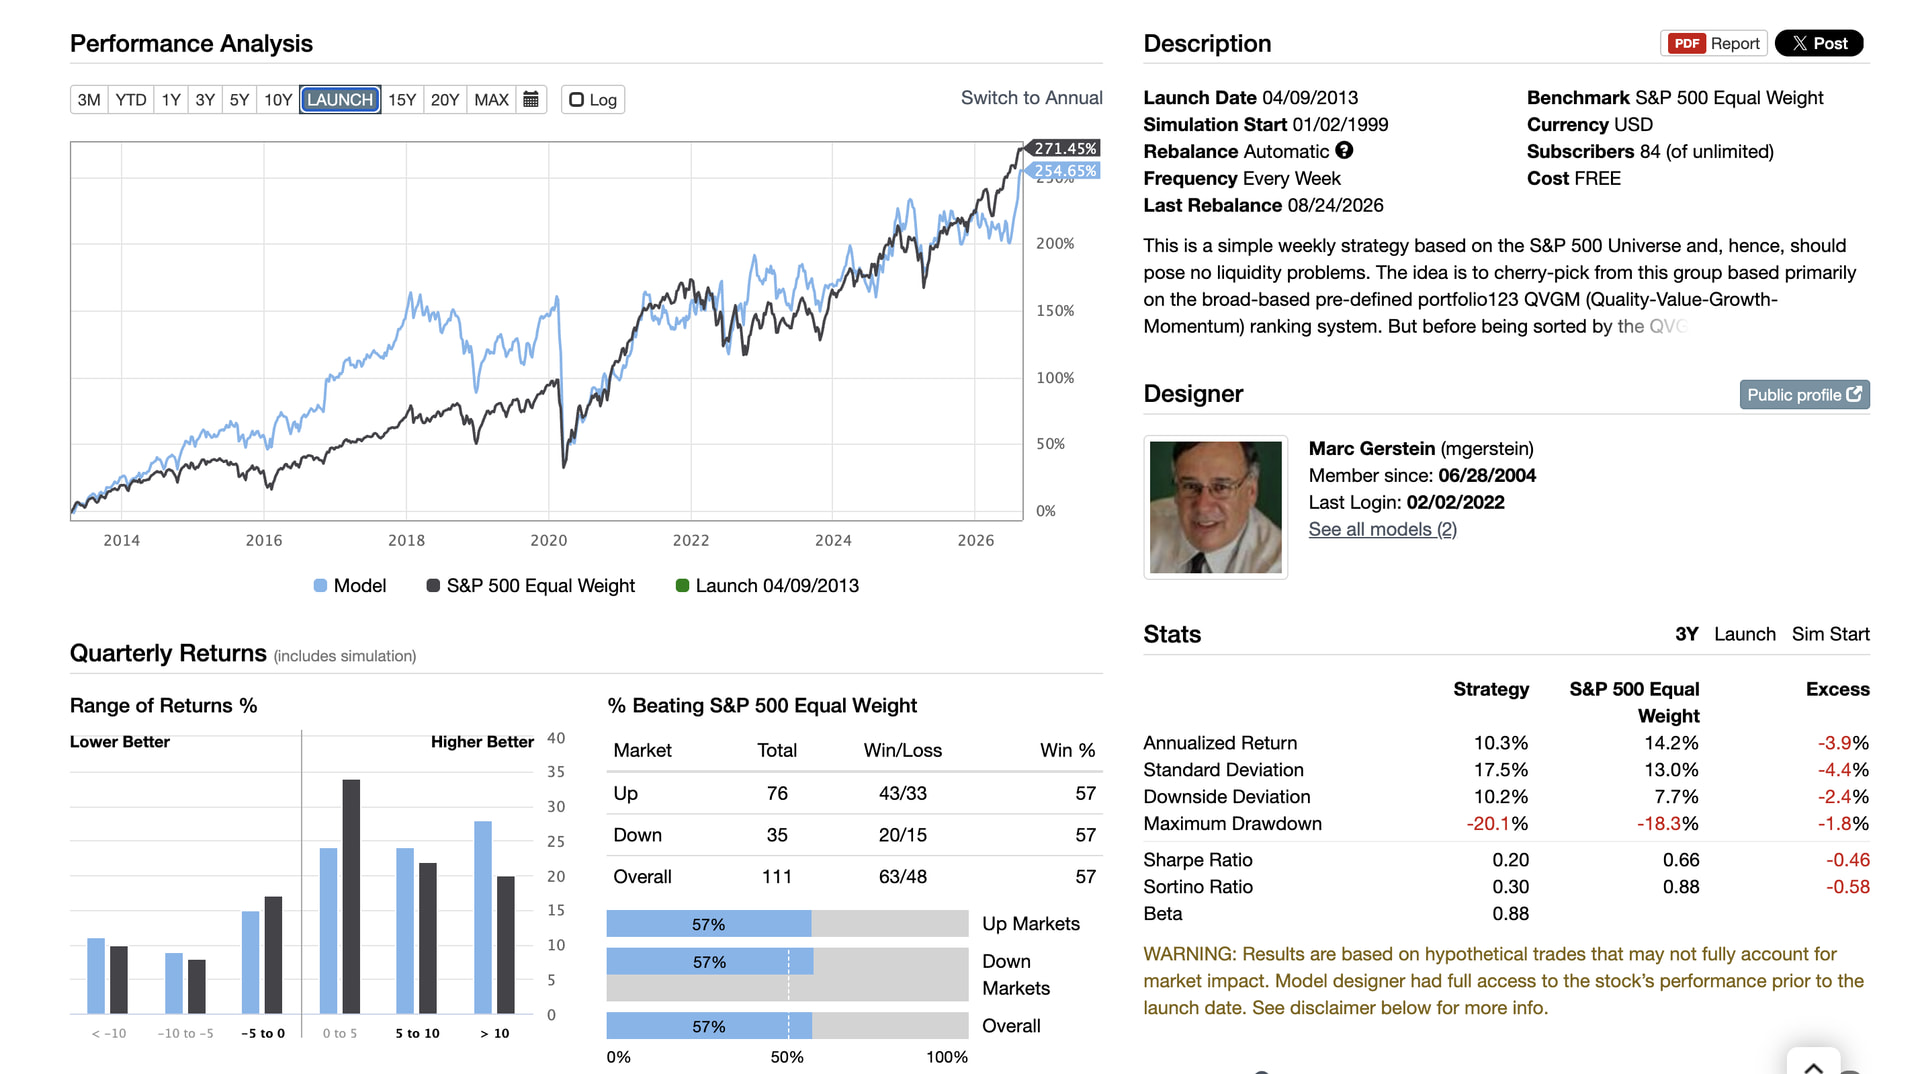
Has anything you've built worked out of sample for large caps? Nothing I've built has worked and I've given up. I suppose it depends on what you mean by "worked." An evaluation ranking system I developed in 2018 has performed like this on global large caps since then. Does that mean it worked? I don't think so.
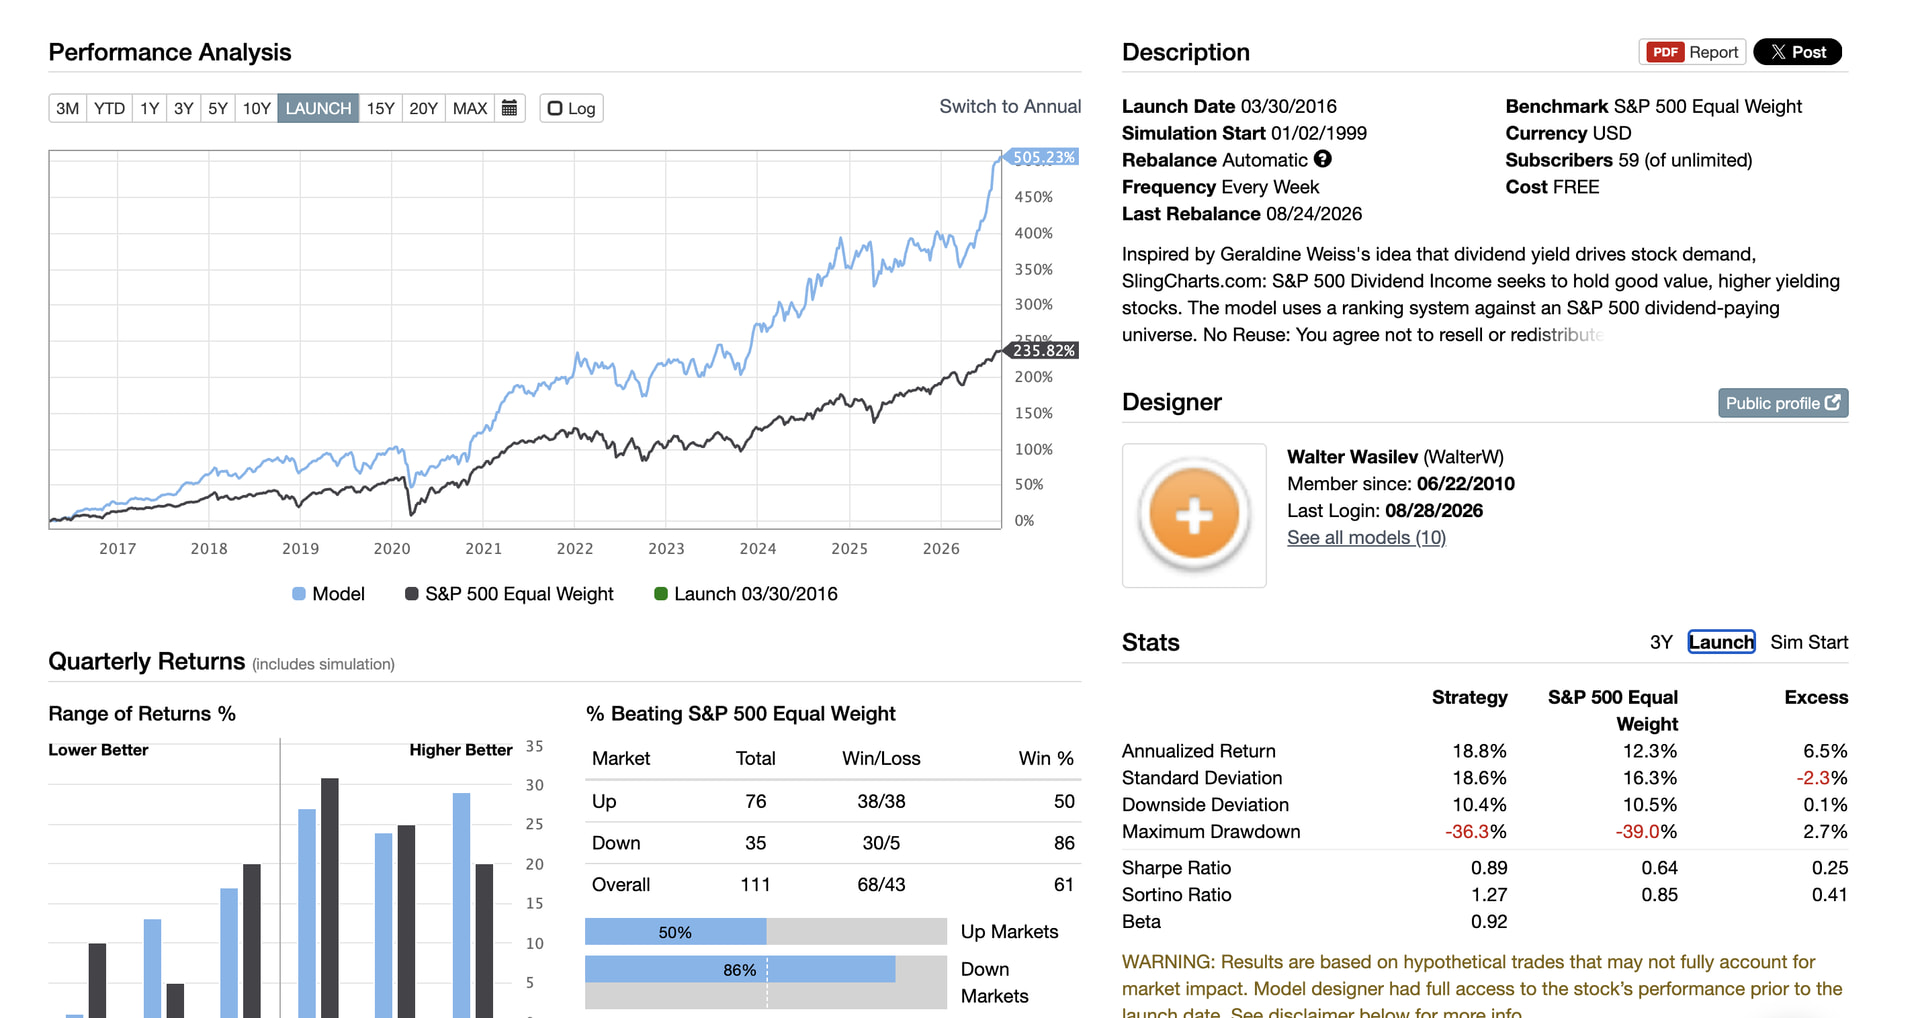
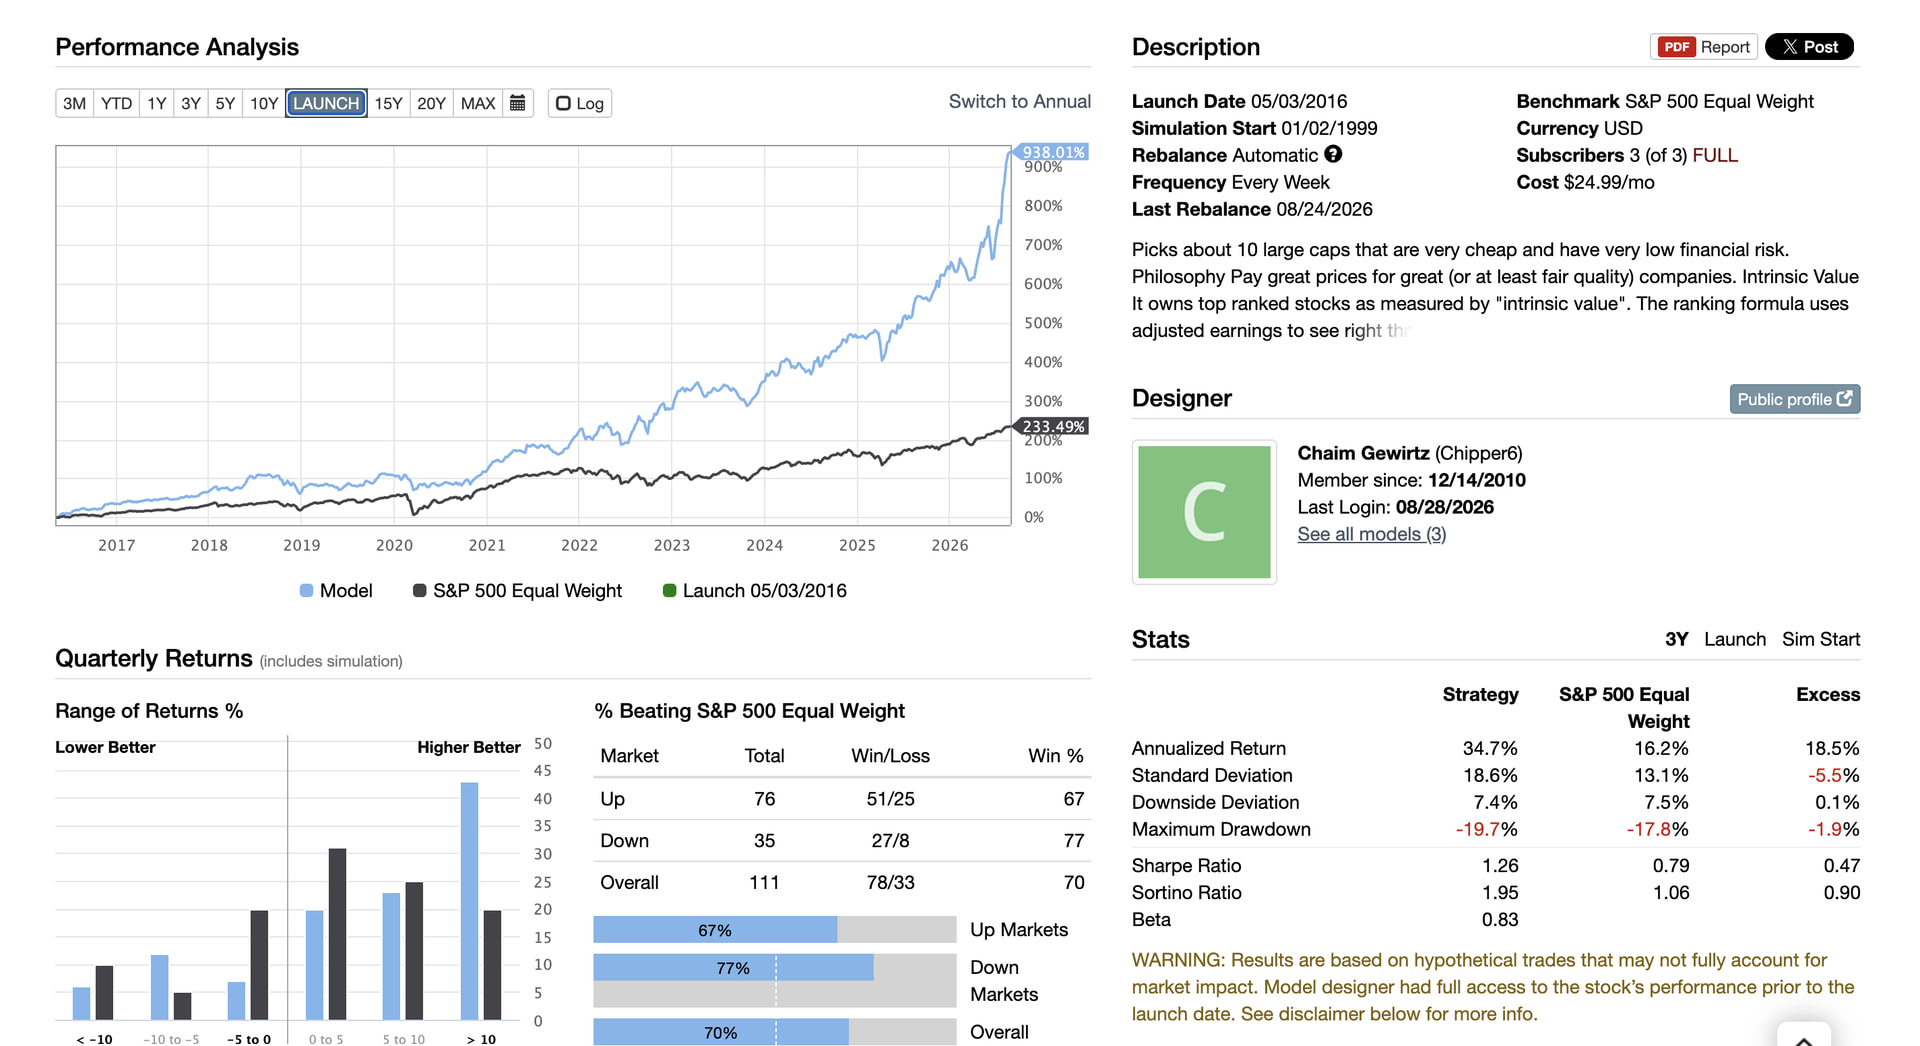
Both @WalterW and @Chipper6 have 5 years results that compare favorably to many popular small-cap and micro-cap strategies that also have survivorship bias and multiple comparison problems:
My conclusion: I could be cherry-picking OOS designer model results by using @WalterW and @Chipper6 's Designer models but there is a similar problem when looking at small- and micro-cap designer models. Maybe it is hard to conclude anything from designer models with the surviorship bias and multiple comparison problems. But I am not ready to say it hasn't already been done with large-caps with any certainty. Large-caps have fewer extreme outliers than small-cap and micro-cap strategies, and 10 years of data is a considerable amount.
My take is that, at the tracking errors concentrated models typically run, even a decade of live data may still be insufficient to distinguish skill from luck with much confidence. So even this handful of longstanding models is only now reaching the point where meaningful statistical examination is possible.
As far as evaluating DMs (of any cap size) goes, trust in the designer—and alignment with the designer’s approach to model construction—is inherently more valuable than a backtest or history of any length viewed in isolation.
And not to keep bringing this up, but it brings me back to my standing issue with the three-month DM window. Even 10 years may not be statistically significant; 3 months, for sure, has no statistical justification: it tells us essentially nothing about whether a model has a durable edge. What it does promote is incubation bias—designers get a free look at initial performance and can choose not to publish models that start poorly. As discussed previously, if clutter is the concern, that is better addressed through UI/UX, while still giving us an earlier and more honest look at what designers are creating.
I do rely on GOOD statistics more than most perhaps. But I agree that one has to question the use of statistics with designer models. I hope that concern was adequately expressed in my post. And I agree this is one of the reasons any statistic regarding designer models is questionable:
So just one other thing though: I cannot think of any designers I trust more than Walter and Chaim.
Right, and Walter's model is based in part on Geraldine Weiss's work, another well-respected voice, which lends further credibility. That's really my point: for those of us who shop the DM marketplace, figuring out which designers you respect (and who those designers respect) is super important.
Imagine if each participant had a credibility-score of sorts. Your comment, for example, would further boost the score of Walter and Chaim, at least to me.
We want this to be science, but at these sample sizes, it's as much an art.
Walter does not talk about his models a lot. But last I heard he was using sophisticated Bayesian statistics. Maybe that has changed that and I am sure there is a lot more to his models that I am not aware of.
Without the survivorship bias it would be trivial to turn this into a science using Bayesian statistics. The distribution of all the models would then be a prior and the DATA of a model a member is interested in would then be the likelihood. The likelihhod, combined with the prior, gives you the posterior odds that that a model is good. Or simply put we COULD know the odds of a model being good.
Sample sizes are a problem but the Bayesian statistics tell you exactly how much of a problem it is for the particular sample size one is looking at. We could actually answer with certainty if 10 years is enough for his or Chaim's model to be significant. This is called Empirical Bayes.
Walter or some other P123 member who understands Bayesian statistics just needs to give us the data to make it a real science.