Uh oh! There goes my hyperplane assumption

If you had an EBM app how would you use it? Personally, I would not fund an EBM model now. Maybe in the future if I learn more about them but not now.

Are EBMs better thought of as discovery tools (because of their transparency) rather than final production models for now? How would you use them with P123?

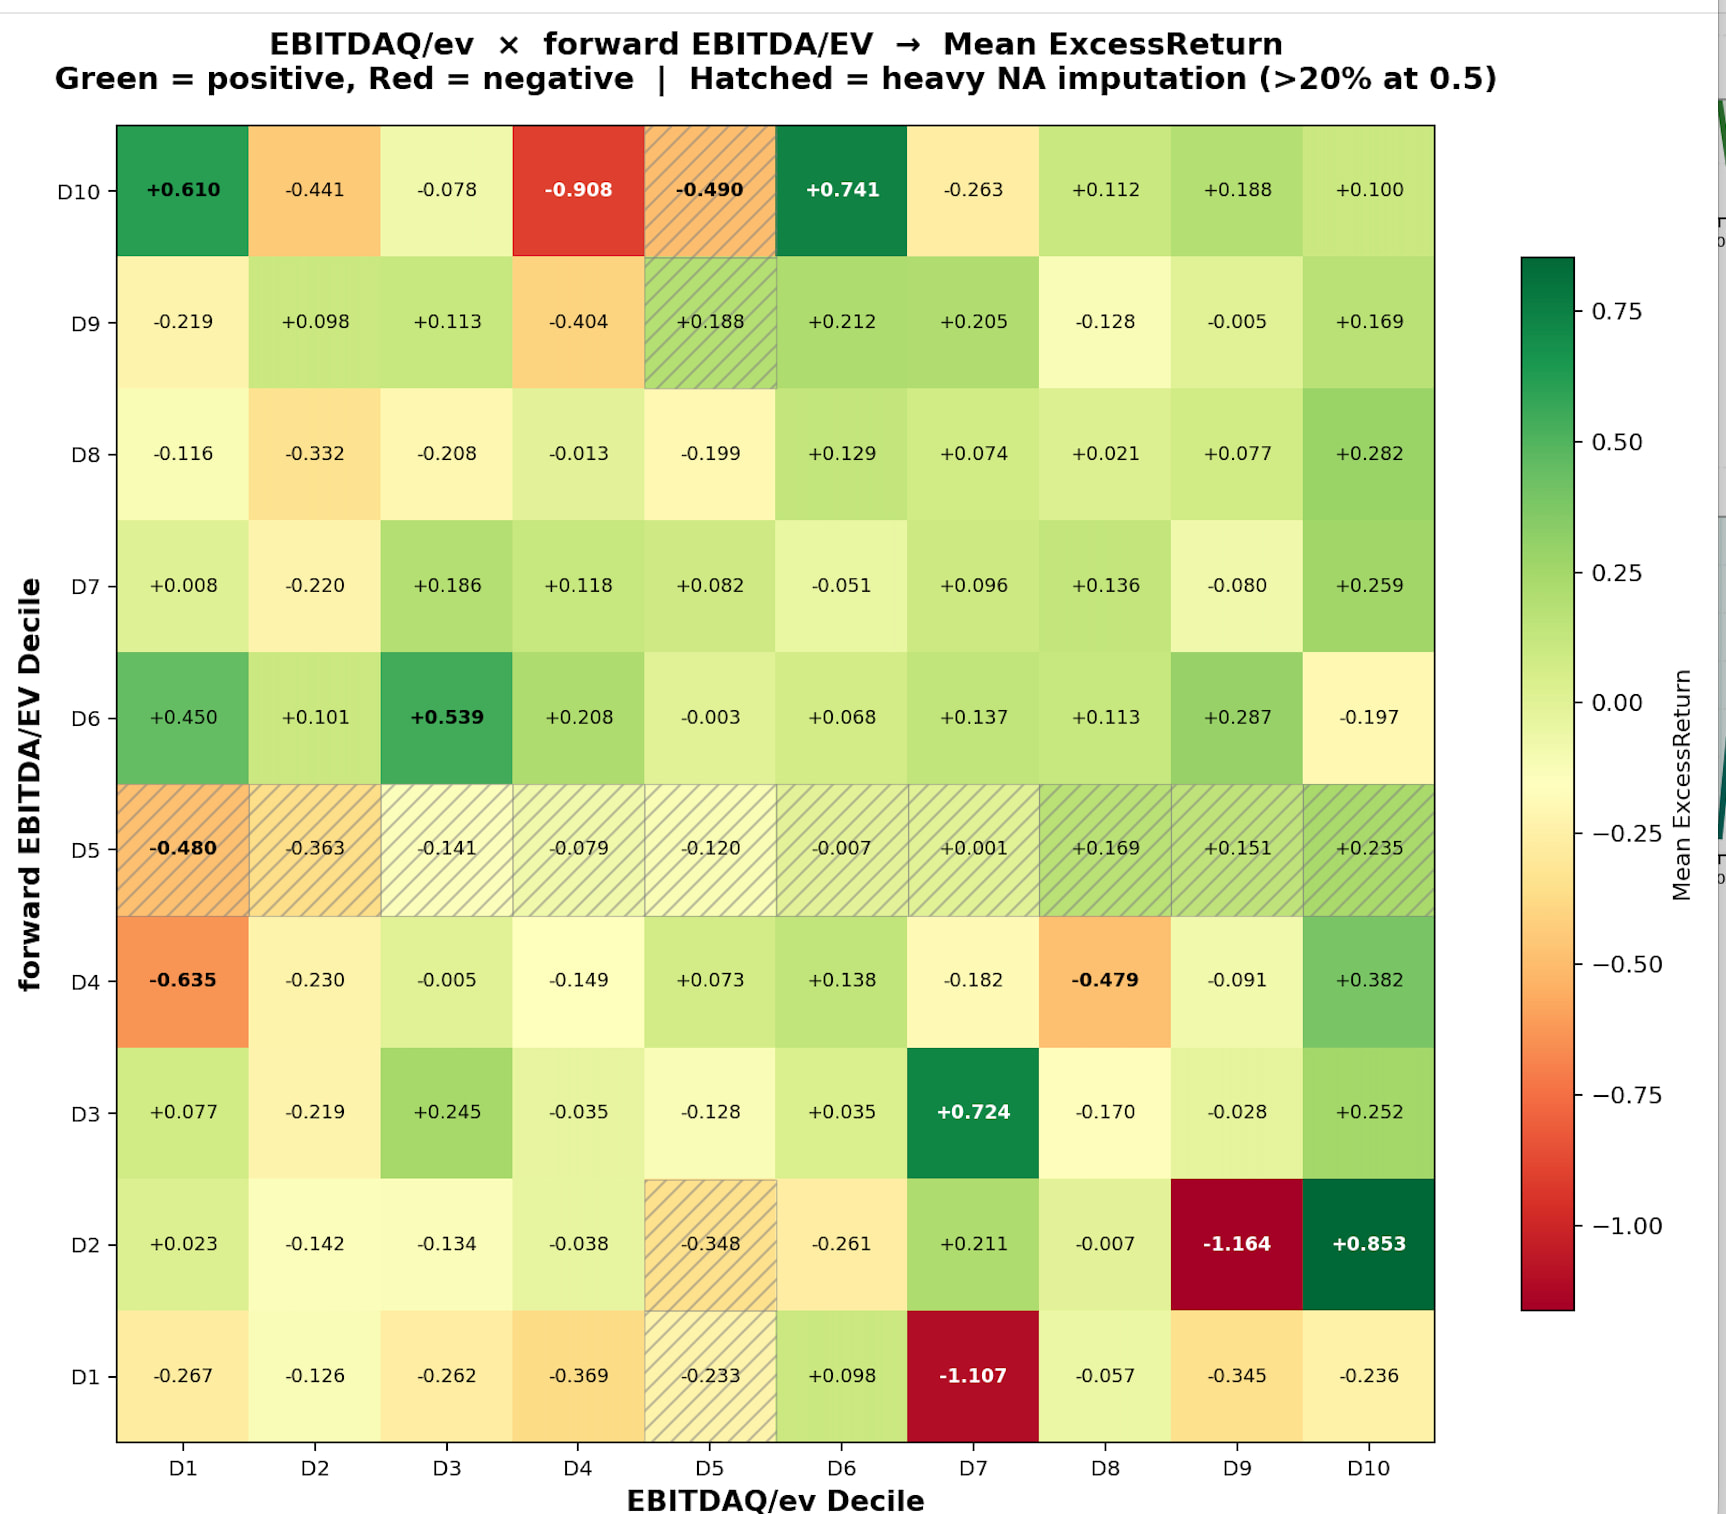
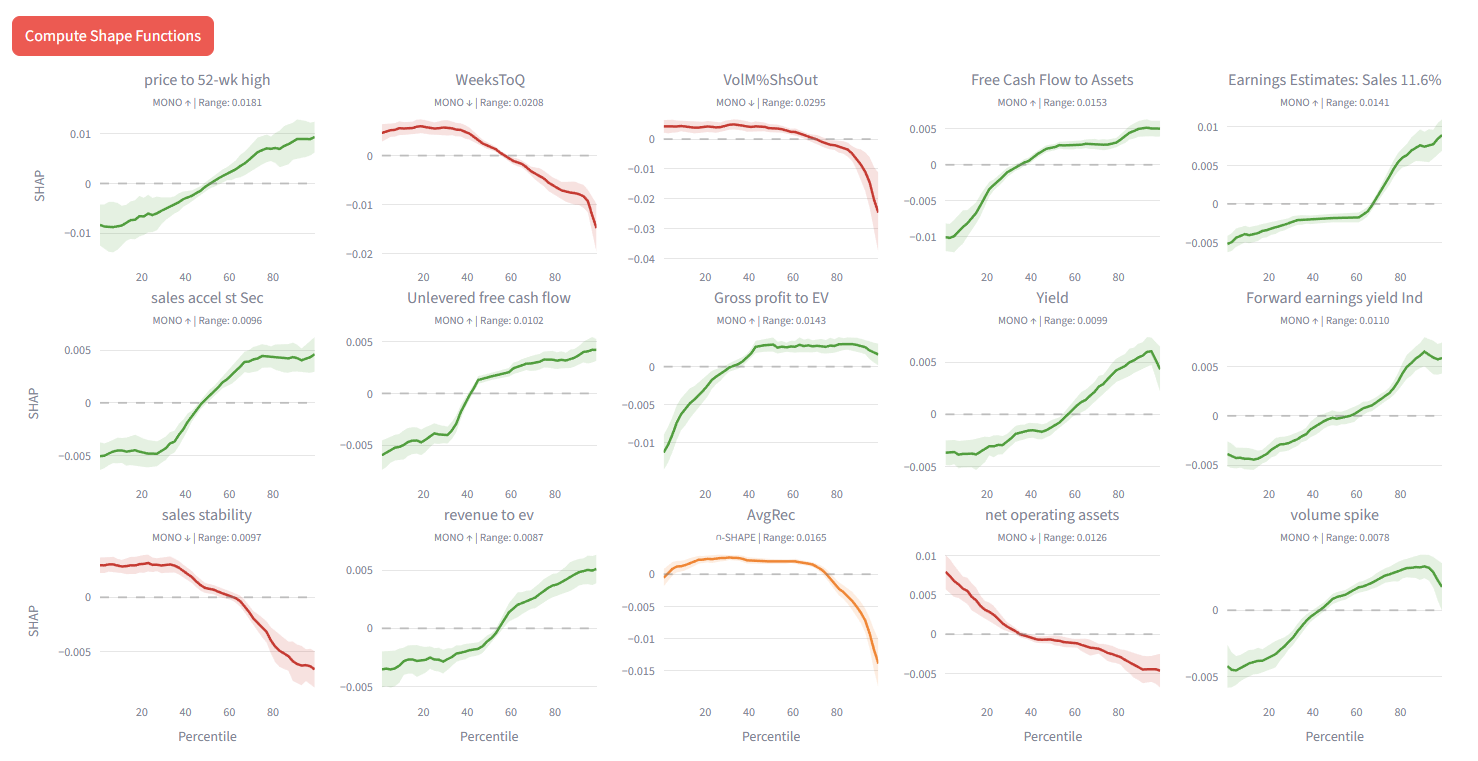
Maybe used with P123’s LightGBM for increased transparency? To search for interactions and anomalies? Maybe as part of a fundamental deep dive? To red-flag unusual situations or anomalies (like the Value Gap Anomaly) affecting a particular stock?

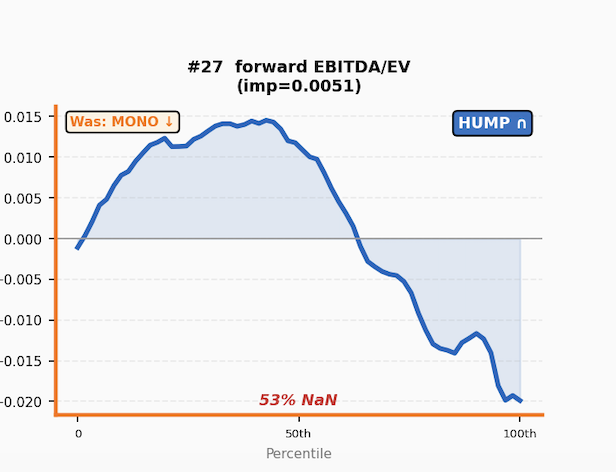
To screen new features to see if they might interact with your core features in a negative way? If pairwise interactions do not show up for that feature that may not be a problem. If an interaction shows up maybe that can be explored with EBM Shape curves and other methods. 3D visualizations as part of any app?

If you had this as an app with P123’s AI 2.0 what would you want to see? How would you use it?

Here are some additional Claude ideas:

Regime monitoring. Train on rolling windows, watch shapes evolve.

Create composite interaction nodes in P123

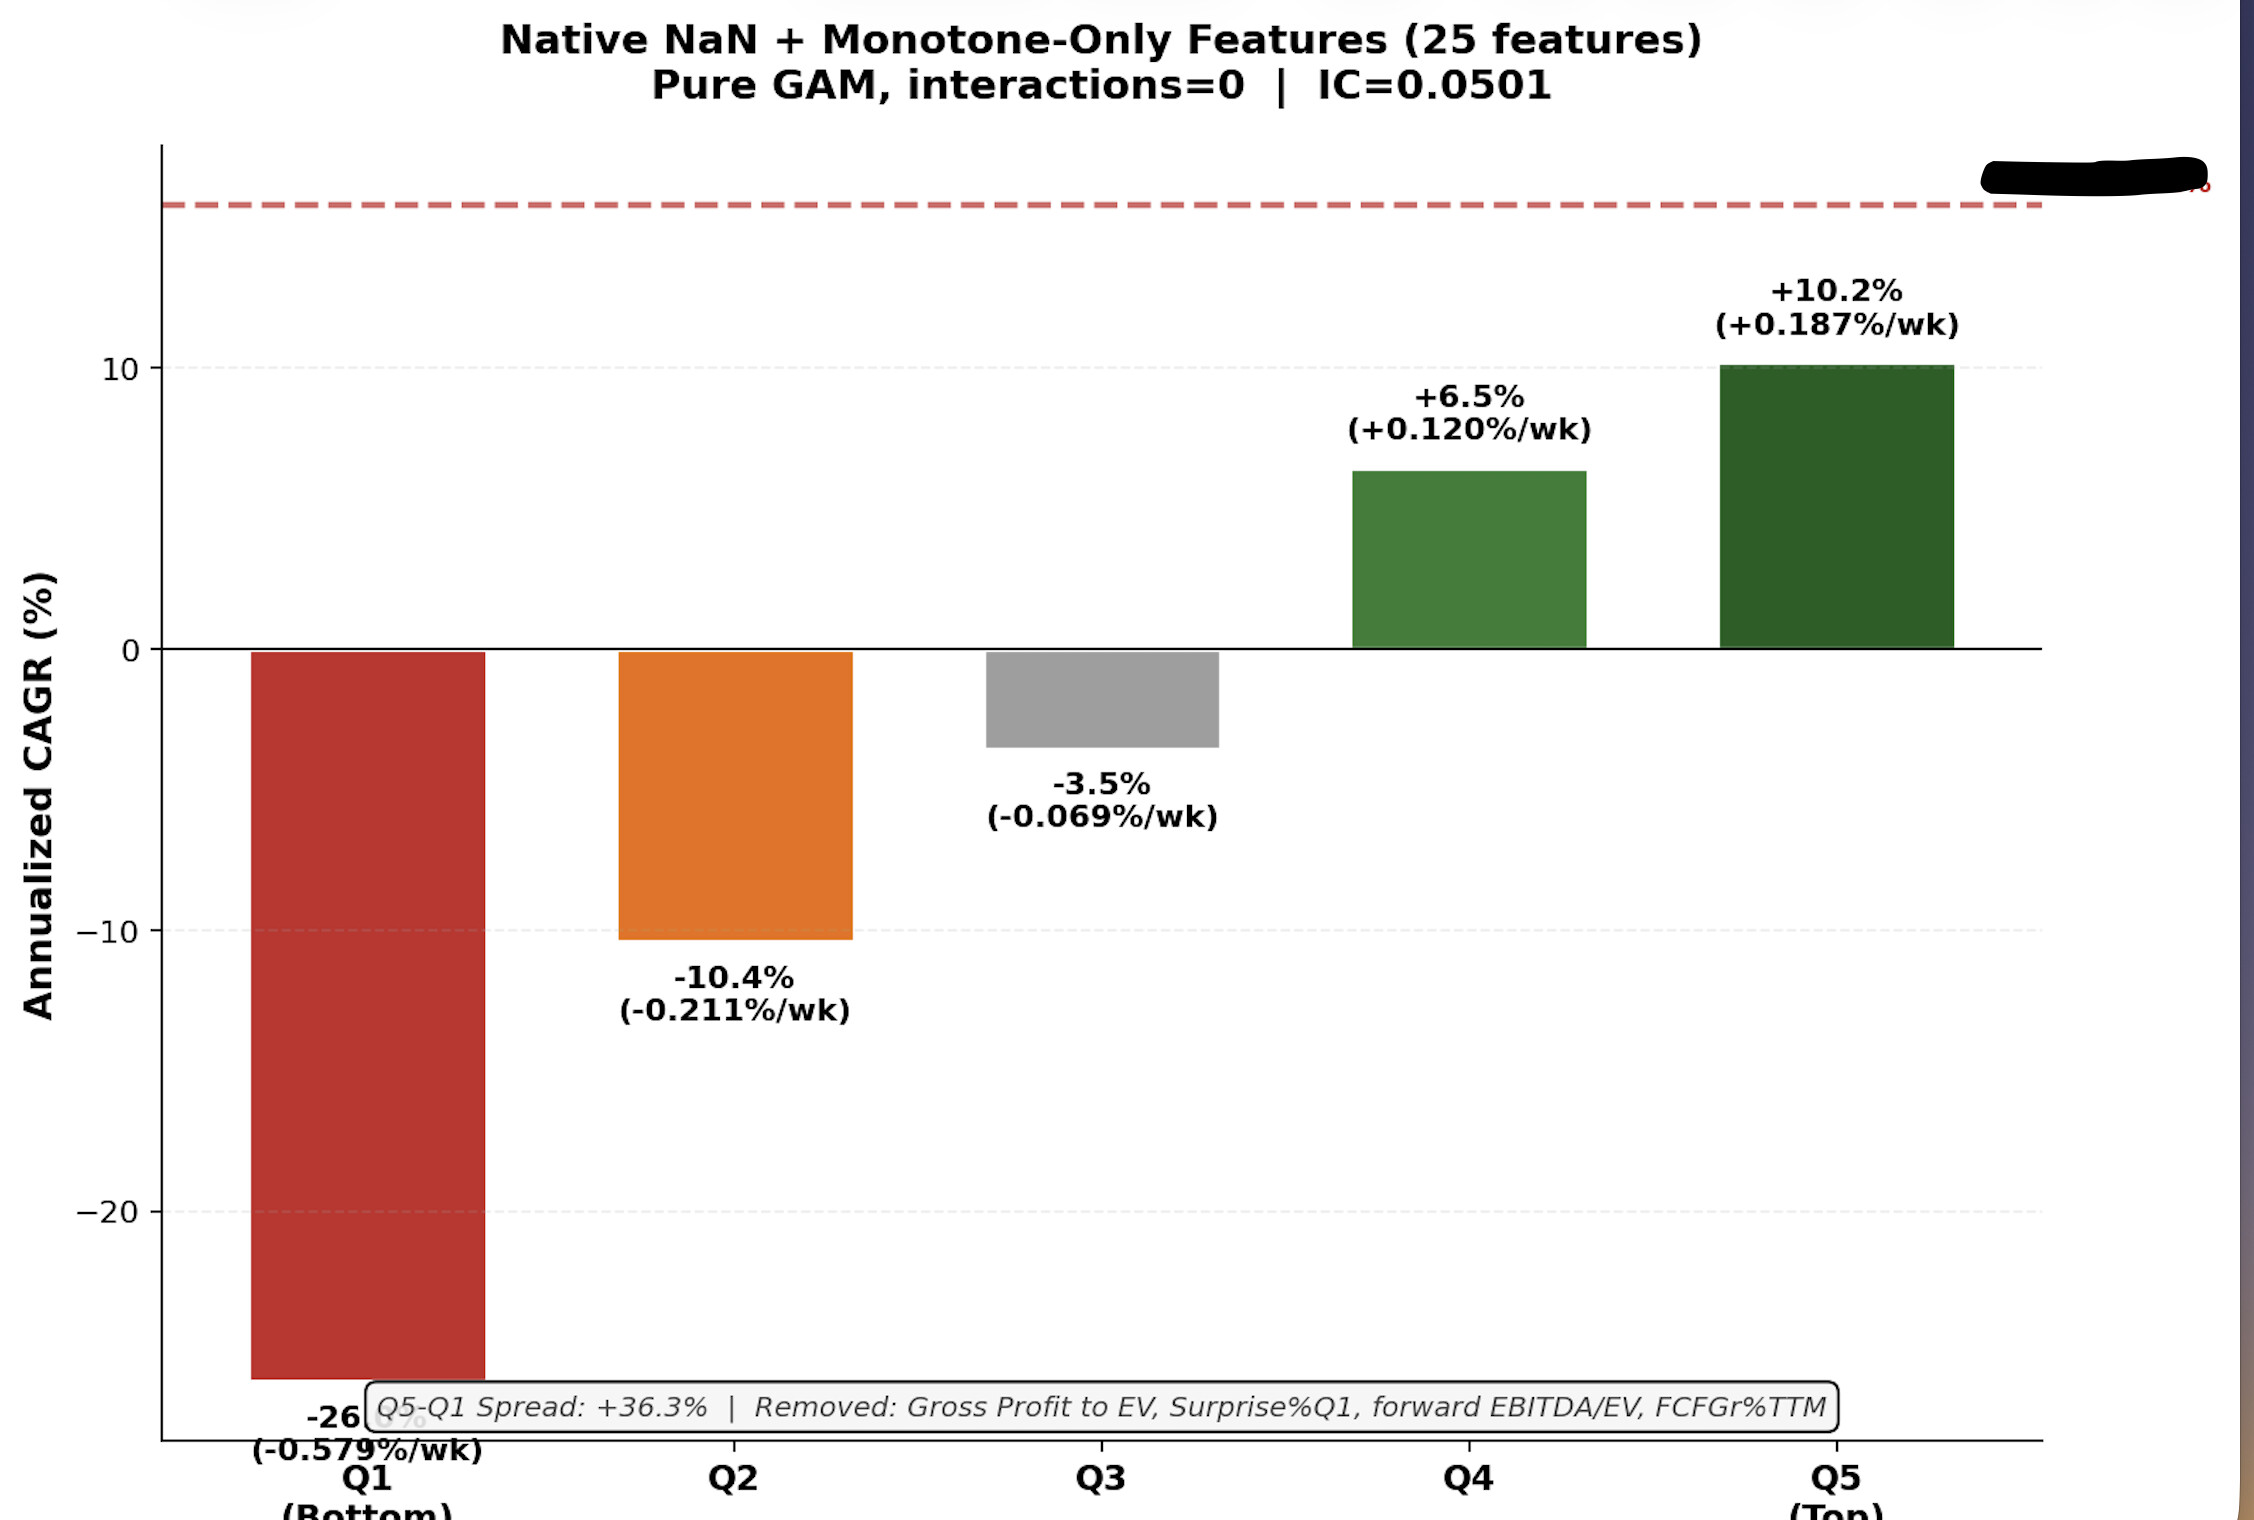
EBM parameters used above: max_bins=64, interactions=10, outer_bags=4, inner_bags=2, lr=0.01, max_rounds=3000, min_samples_leaf=100, max_leaves=3

Subsample to ~200K for training — larger datasets OOM kill the process.

In the weeds but maybe the most important thing. Claude expands the the curse of dimensionality below:

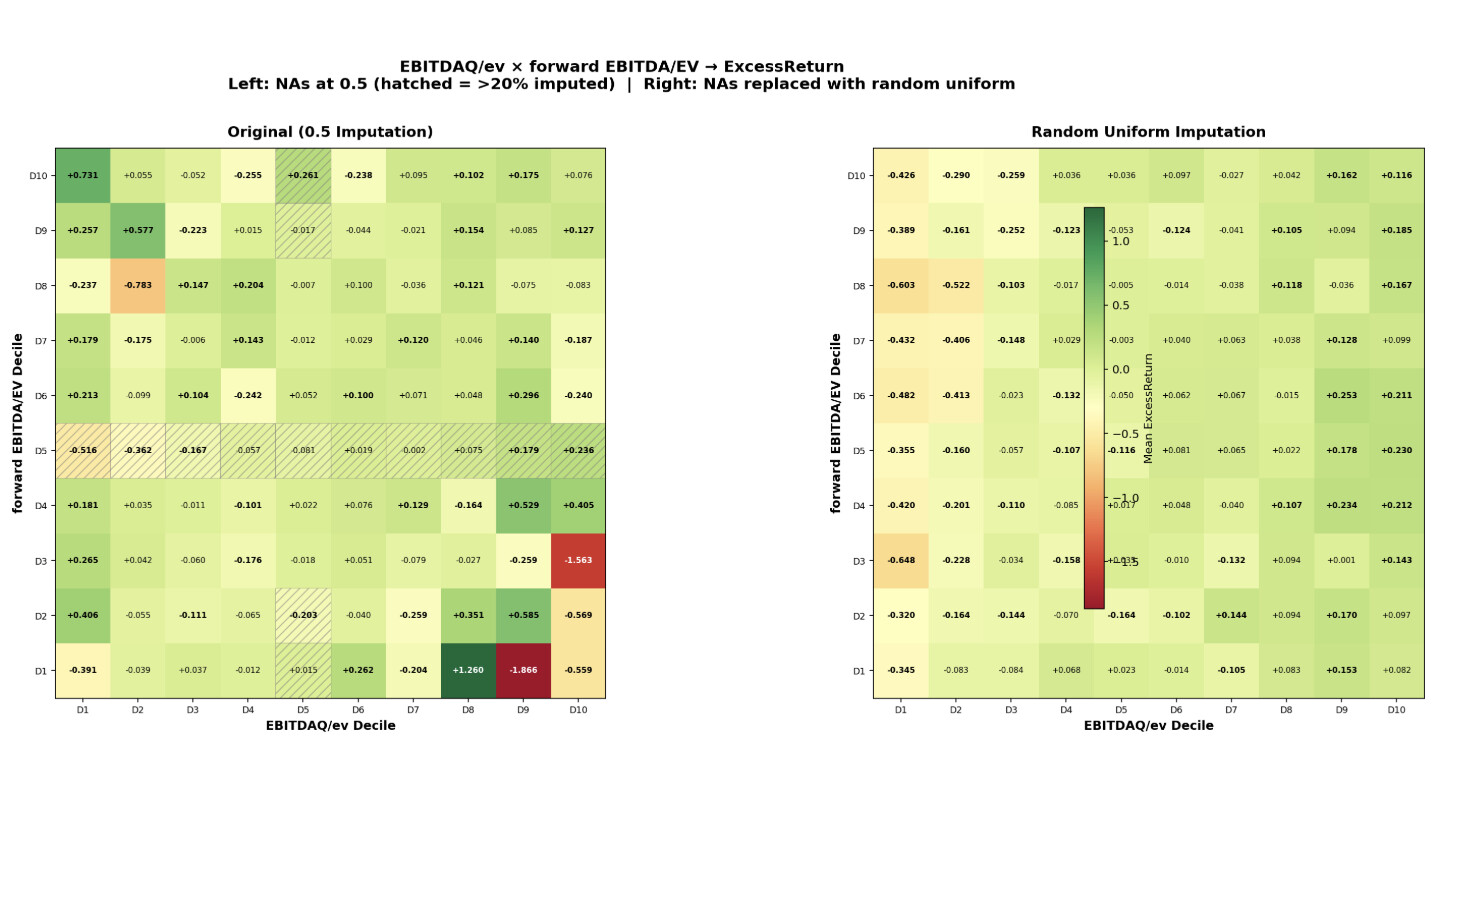
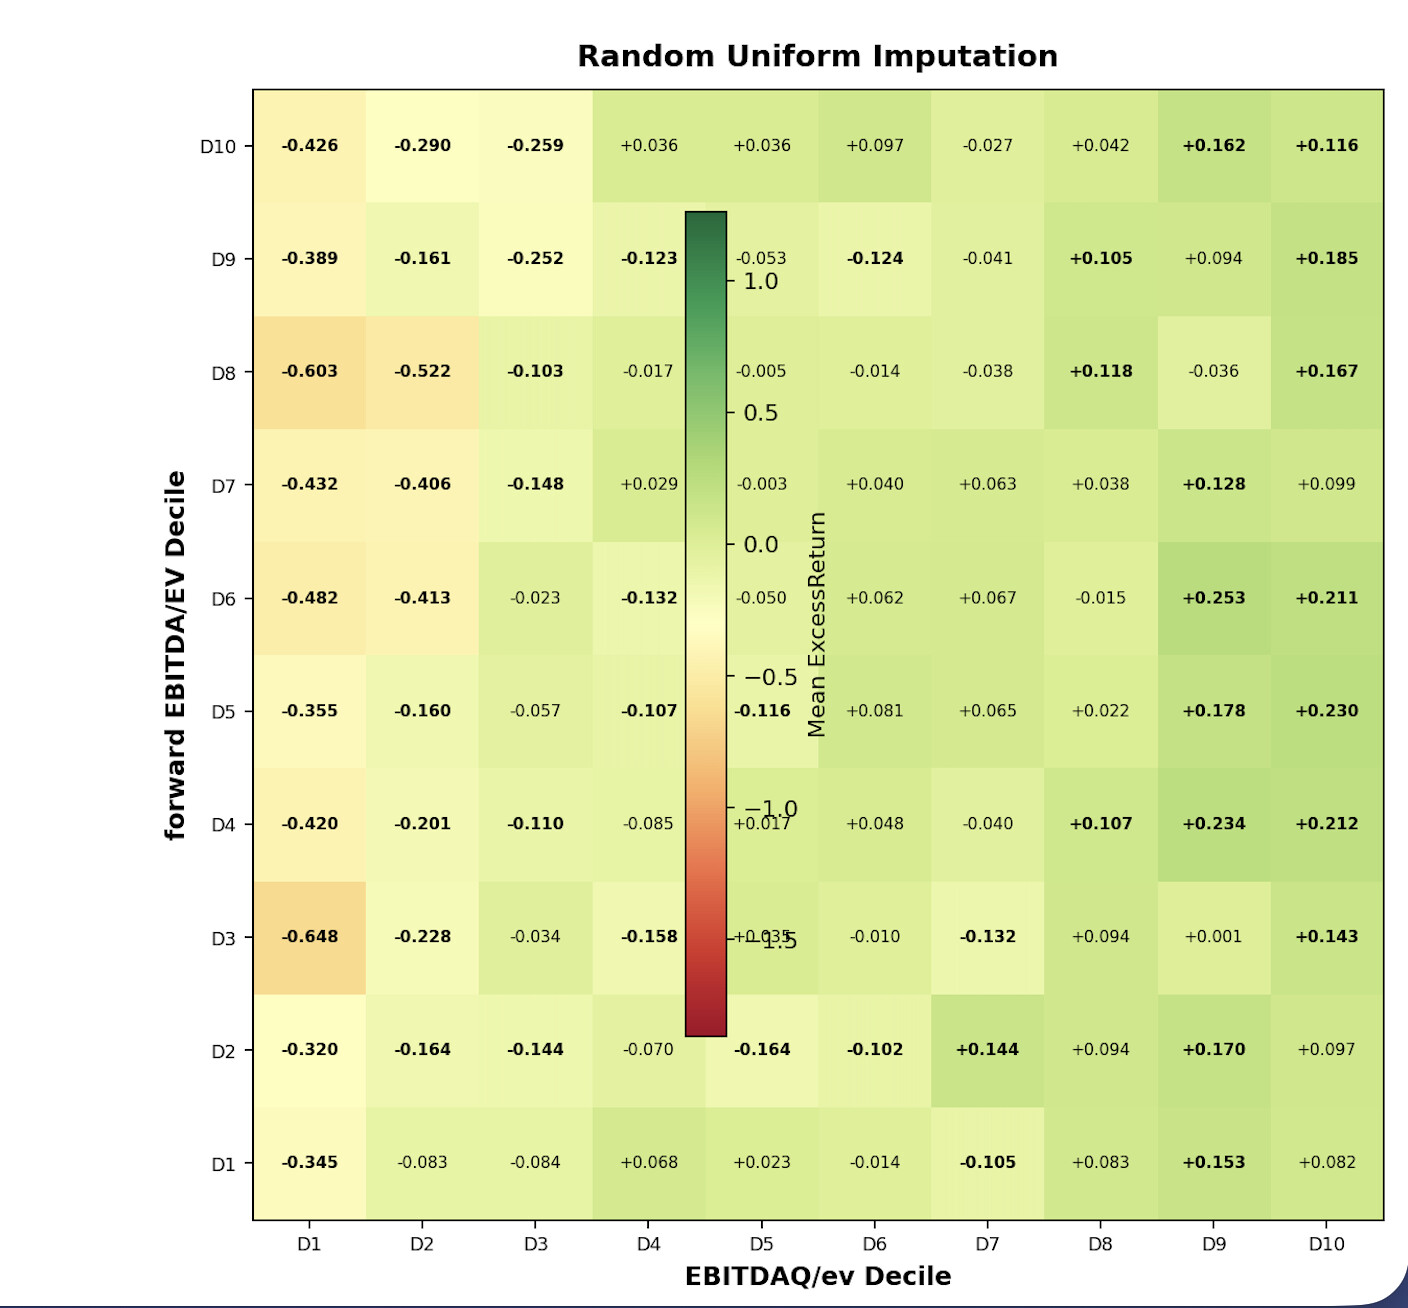
TL;DR: We don’t really have enough data to create a good non-linear manifold. Maybe exploring some corners is realistic but as a model it has problems.

Claude: "One caveat on interactions: with n features and decile bins you have 10^n [1 followed by 29 zeros] possible corners of the feature space. Your investable universe is maybe 4,000 stocks observed weekly. Most corners of the manifold will never be visited by any stock in your dataset — they don't just lack statistical power, they're empty. So any practical model has to focus on the low-dimensional projections where the data is dense enough to learn from. Full interaction modeling is probably unexploitable even in theory for most feature combinations."

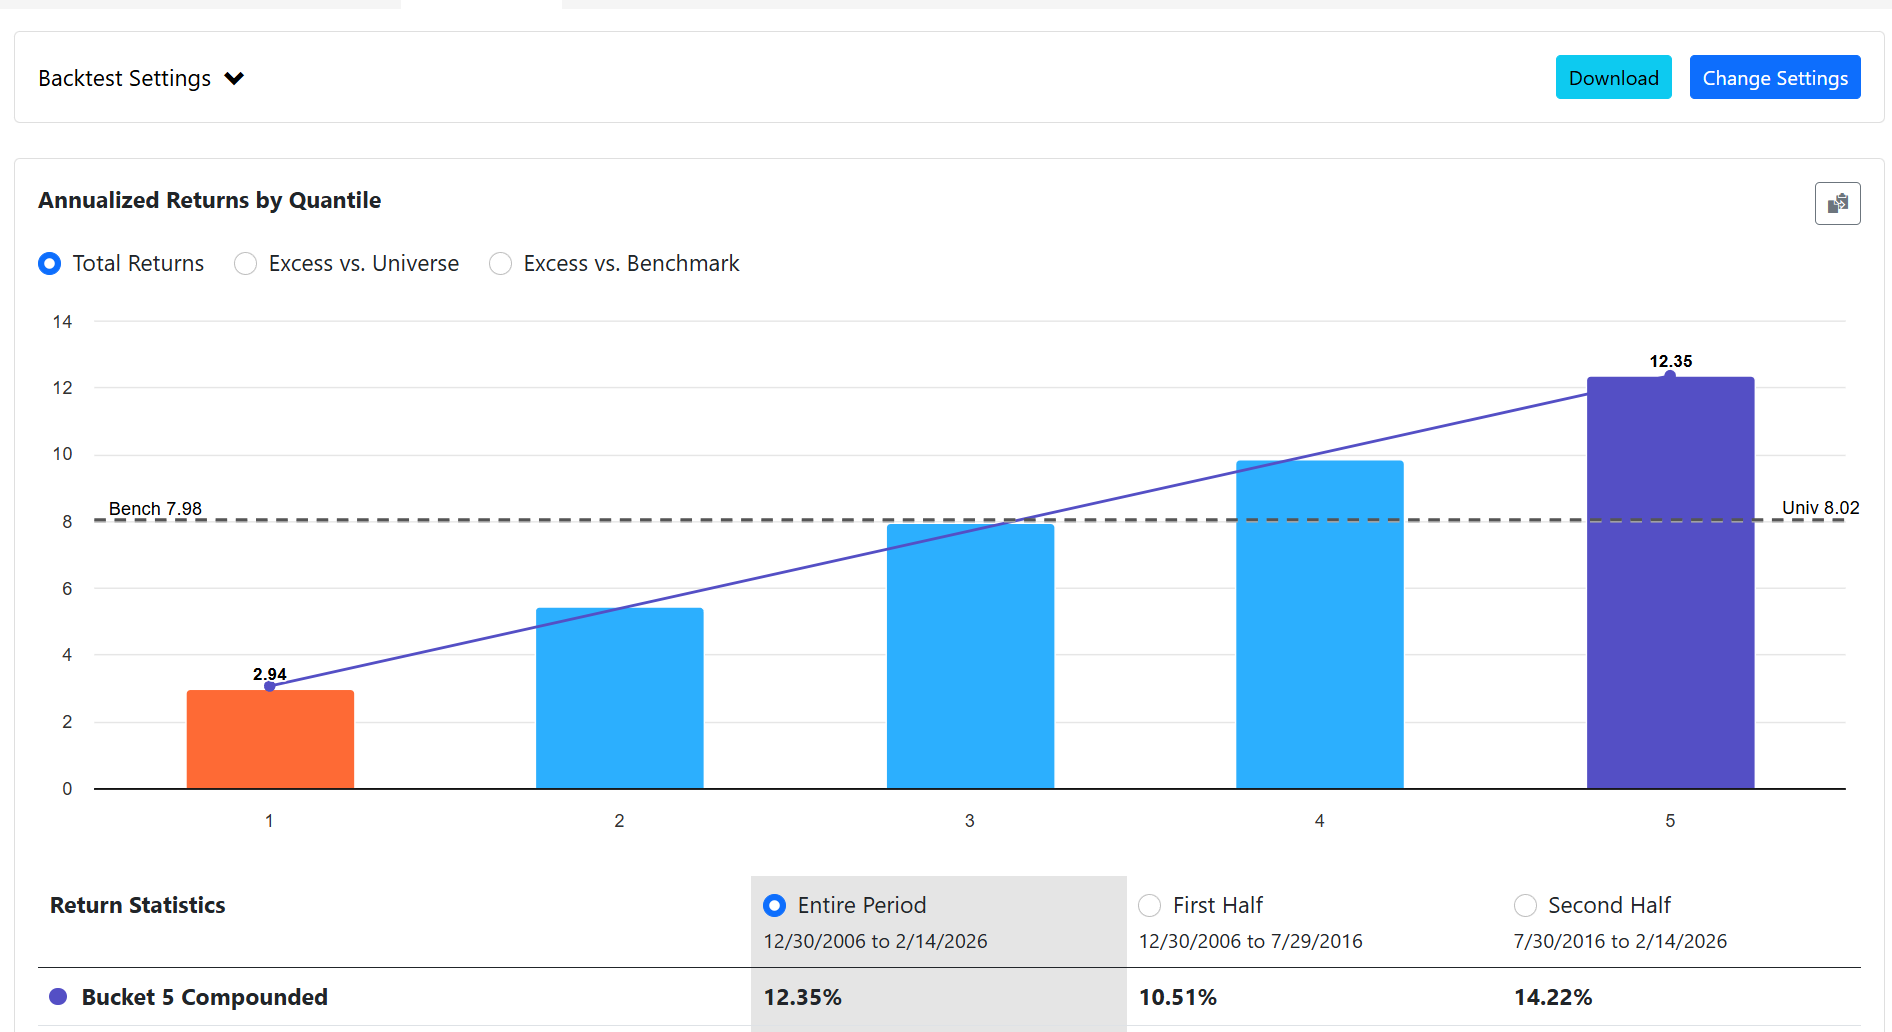
Or a manifold projection (rank performance test) can be both a bug and a feature.

This heat map quantifies the NAs for both features to some extent with hatching (> 20%). At least within a decile but still lacking the total number of NAs.

Notice the NA’s missingness may be informative in some portions of this heat map, making your multiple methods of imputation a very nice feature! Which method to use probably should not be automatic as you know.

My first thought was to perform studies and learn. I use backtests not to find the best low probability permutation in the past but to learn and confirm an hypothesis. This openess is better for studies vs a black or dark box

1 Like

Me too now. I even have an app ready for the 3D plots (not the EBM) and I am sure there would be some interest. But for now it is clunky. Specifically it needs a Jupyter Notebook, paths to csv file, entering exact feature names etc. Maybe I can learn how to make compact and useful apps for P123’s AI 2.0.

1 Like

Apps are coming. Will be very fun. I can see myself funding or making some

1 Like

I will send you the codebase for the little app that imputes values for NA's, would be very interesting to get it differences visualized. Would quite quickly be able to determent if NA's is playing a trick.

1 Like

I did random imputation. Not sure if I will get to the other imputations but it was interesting:

Here is without imputation on the left and with it on the right:

Here is a magnified view with imputation:

I think the only strong conclusion is that imputation certainly smooths-out the right heat map. This supports the idea that using imputation in your app might be useful at times.

The right heat map is smooth enough that it could be called a hyperplane perhaps. But also if the heat map is accurate (and not a statistical anomaly) then the effect offorward EBITDA/EV for each decile of EBITDA/EV is flat or mildly monotonically decreasing.

My understanding of EBM’s 2D shapes is something like the “correcting for” that we hear for linear regression studies in medicine all the time. This being a non-linear regression (or GAM). In medicine, we often hear something like “correcting for age and the number of hospital visits there was no statistically significant effect.”

Same here: “correcting for EBITDAQ/EV, forward EBITDA/EV did not have a practically significant effect. Probably not statistically significant either but I did not check for that.

Collinearity may explain this perhaps, as you suggest above.

So this EBM model does in fact improve by when features that have a monotonically decreasing 2D EBM shape (like forward EBITDA/EV and others) are removed. This leads to the following possibility:

Potentially, identifying features that have little or no effect when controlled for by other features, could simplify models and maybe even improve their predictions.

I just tried all the imputation methods on a LightGBM model, and using the native NaN handling was definitely the best method.

EBM is supposed to have a good native NaN handling to. Try to replace all the 0.5 values with NaN and see how that worksout.

Cool!

I will see if I can impute all 0.5s to NA and see what happens to the EBM results.

Thanks!

One Caveat to keep in mind. To get it to run I had to use a small subsample of the data (memory constraints). If I went in to production I would just use an ensemble of multiple runs. That might improve the result. But for these results there is some variation between runs.

Based on the 2D Shape graph and the argument about “controlling for” above forward EBITDA/EV might still be a candidate for removal:

This shape may not be significant. Some of this may be noise and there may not be a true decline perhaps. But I do think removal of this feature could be considered for multiple reasons including the 2D shape.

Using native NA handling did not help the top quintile for this model over the test period. I did remove forward EBITDA/EV here because my models seem to improve when features that have 2D shapes that are no longer monotonically increasing are removed. These are excess returns relative to the universe::

Look, I managed to generate EBM Shape like functions using SHAP values with LightGBM.

2 Likes

So cool!!! How do we use that?

Testing Streamlit and added the "Shape function" it as a part of the app.

I assume the predictor we use in P123 is a pickle file, if that is the case that file can be used as is. To get the names of each shape (instead of just a feature number), we would need to map the CSV feature file somehow.

1 Like

WeeksToQ is interesting one!
It somehow works ... lower better, sector rank, russell 2000.
But the question is why ?

So we may need to be careful with WeeksToQ: WeeksToQ

But if the directions are not switched then I wonder why as an individual feature it is clearly monotonically increasing (as you have shown), but monotonically decreasing with other features as shown by AlgoMan’s SHAP curve.

As far as how to use this in LightGBM maybe turn off monotone constraints for this one (whether it it PIT or not). But I think there may be even more to this.

1 Like

WeeksIntoQ is probably better to use, Yuval pointed out the other day WeeksToQ can be forward-looking the other day.

Anyways, they are really powerful together with Analyst Recommendations and Estimates. If an analyst change the estimate far in to the quarter he is probably just late on the ball and his update probably has no market effect.

2 Likes

I use Between(WeeksIntoQ, 0, 14) in a Universe definition, Depending on the screen its impact is either indifferent or +/- 15-20%. No real handle on screen rules and the observed results.

Cheers,

Rich

Out traveling and I only have my phone, but with the help of Claude I managed to test how well the SHAP functions can be used to pick the ”best” linear (monotonic shape) factors for a classic ranking system.
I had screenshots of all SHAP functions/graphs and asked it to find the best candidates (pristine monotonic shapes), weight them based on the range. In addition I asked it to find the best candidates for Binary signals, typically partly flat curves, set the binary threshold where the curve intercept 0.

I got 33 factors of which 10 is binary.
With no optimization I got this result with sell rule <95.

I’m impressed, 0 optimization done, just copy paste the XML code.

4 Likes

No 2018 dip or period of flat returns. Great return for no overfitting and no multiple comparisons. Nice turnover

And makes sense (monotonic and binary SHAP curves).