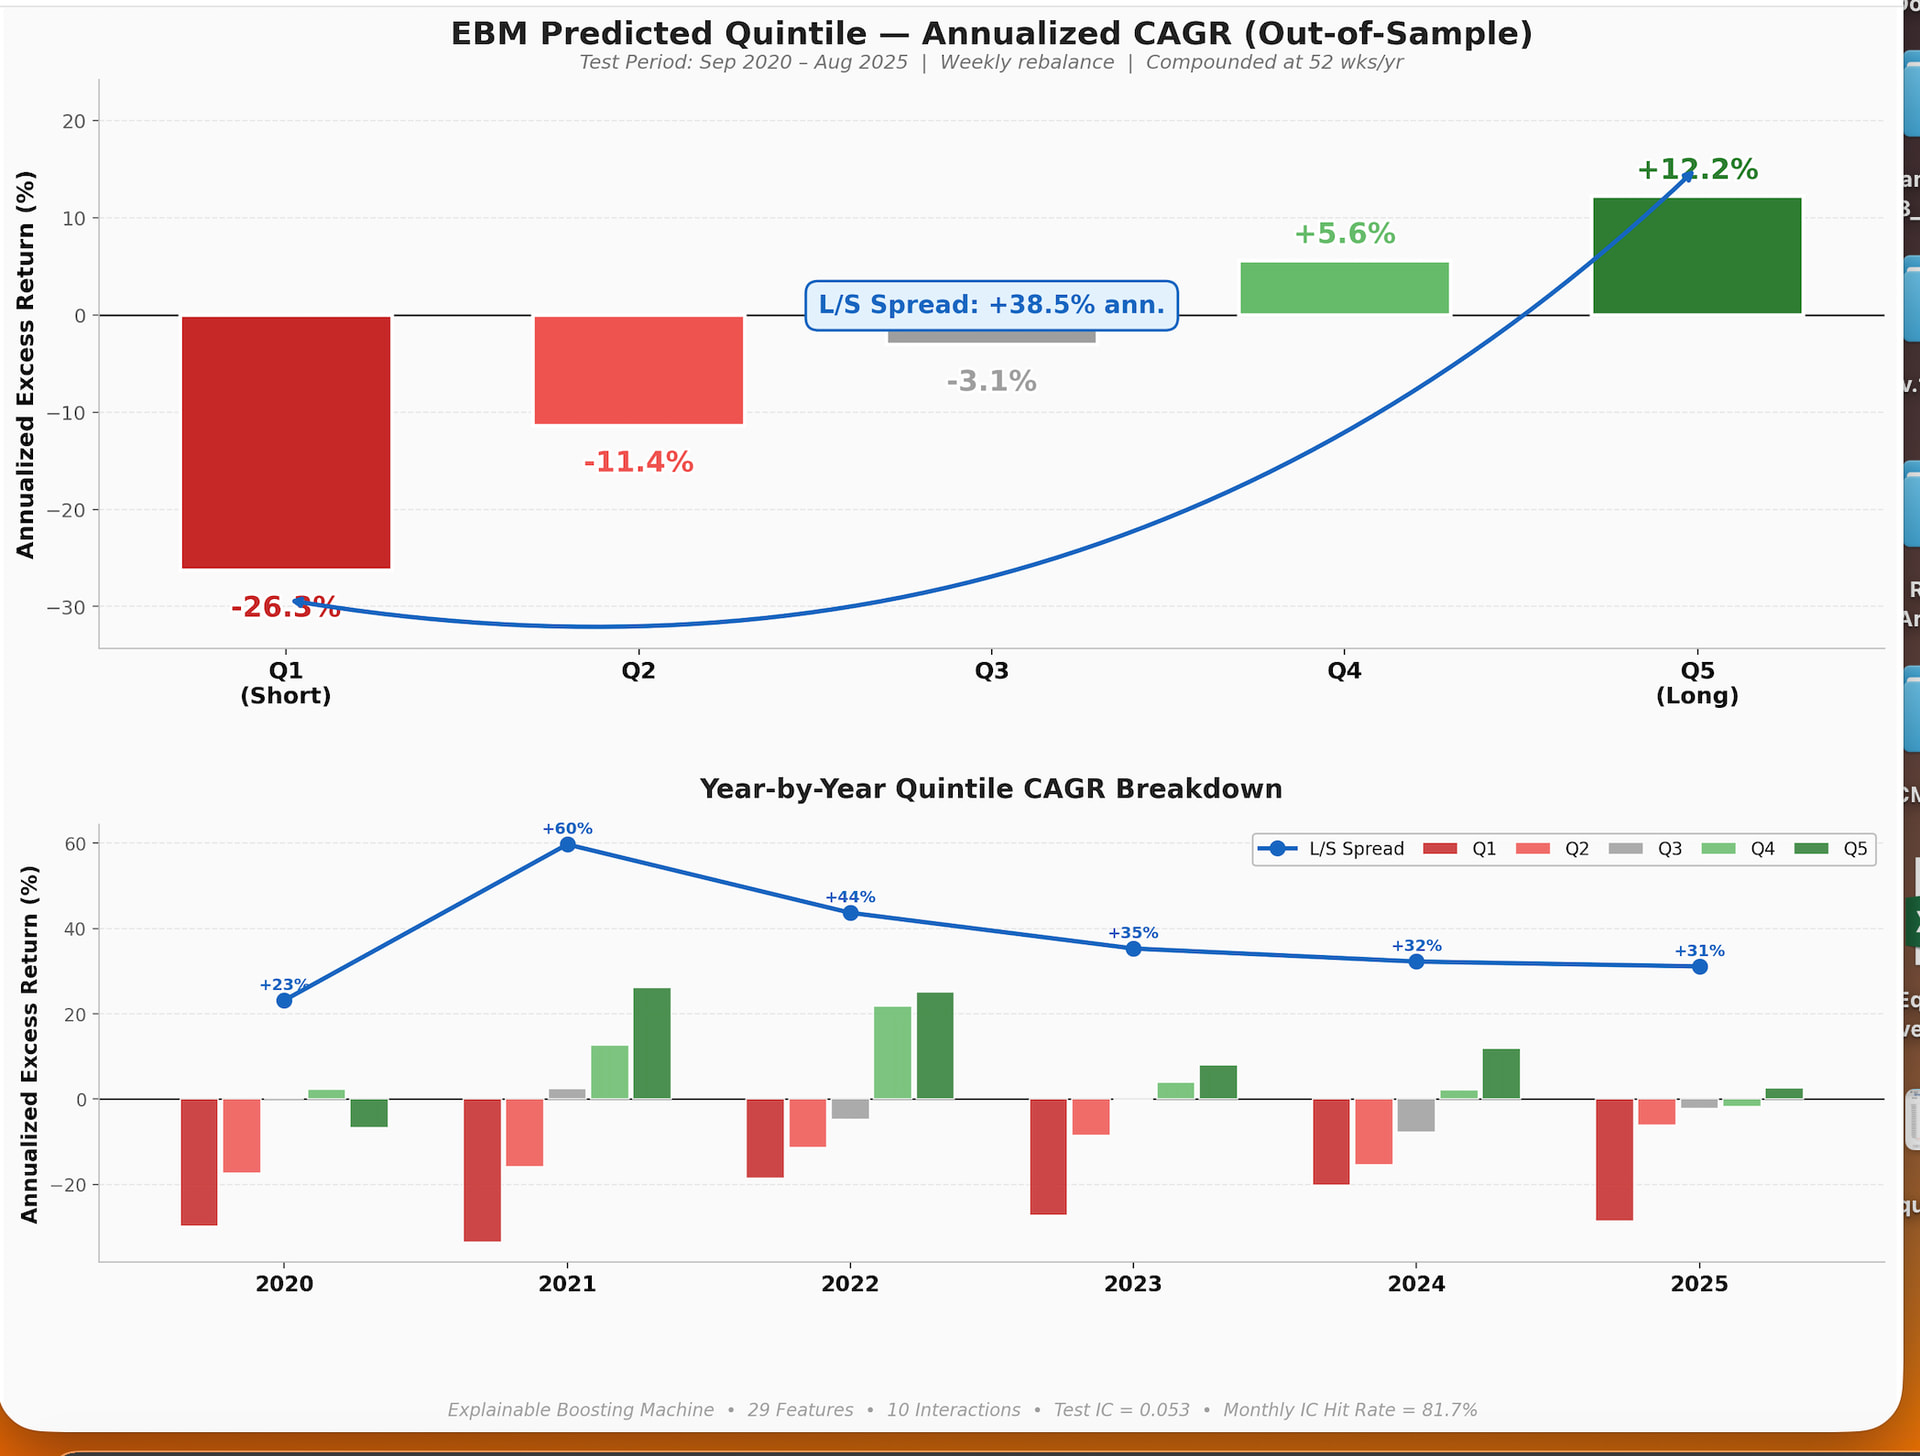
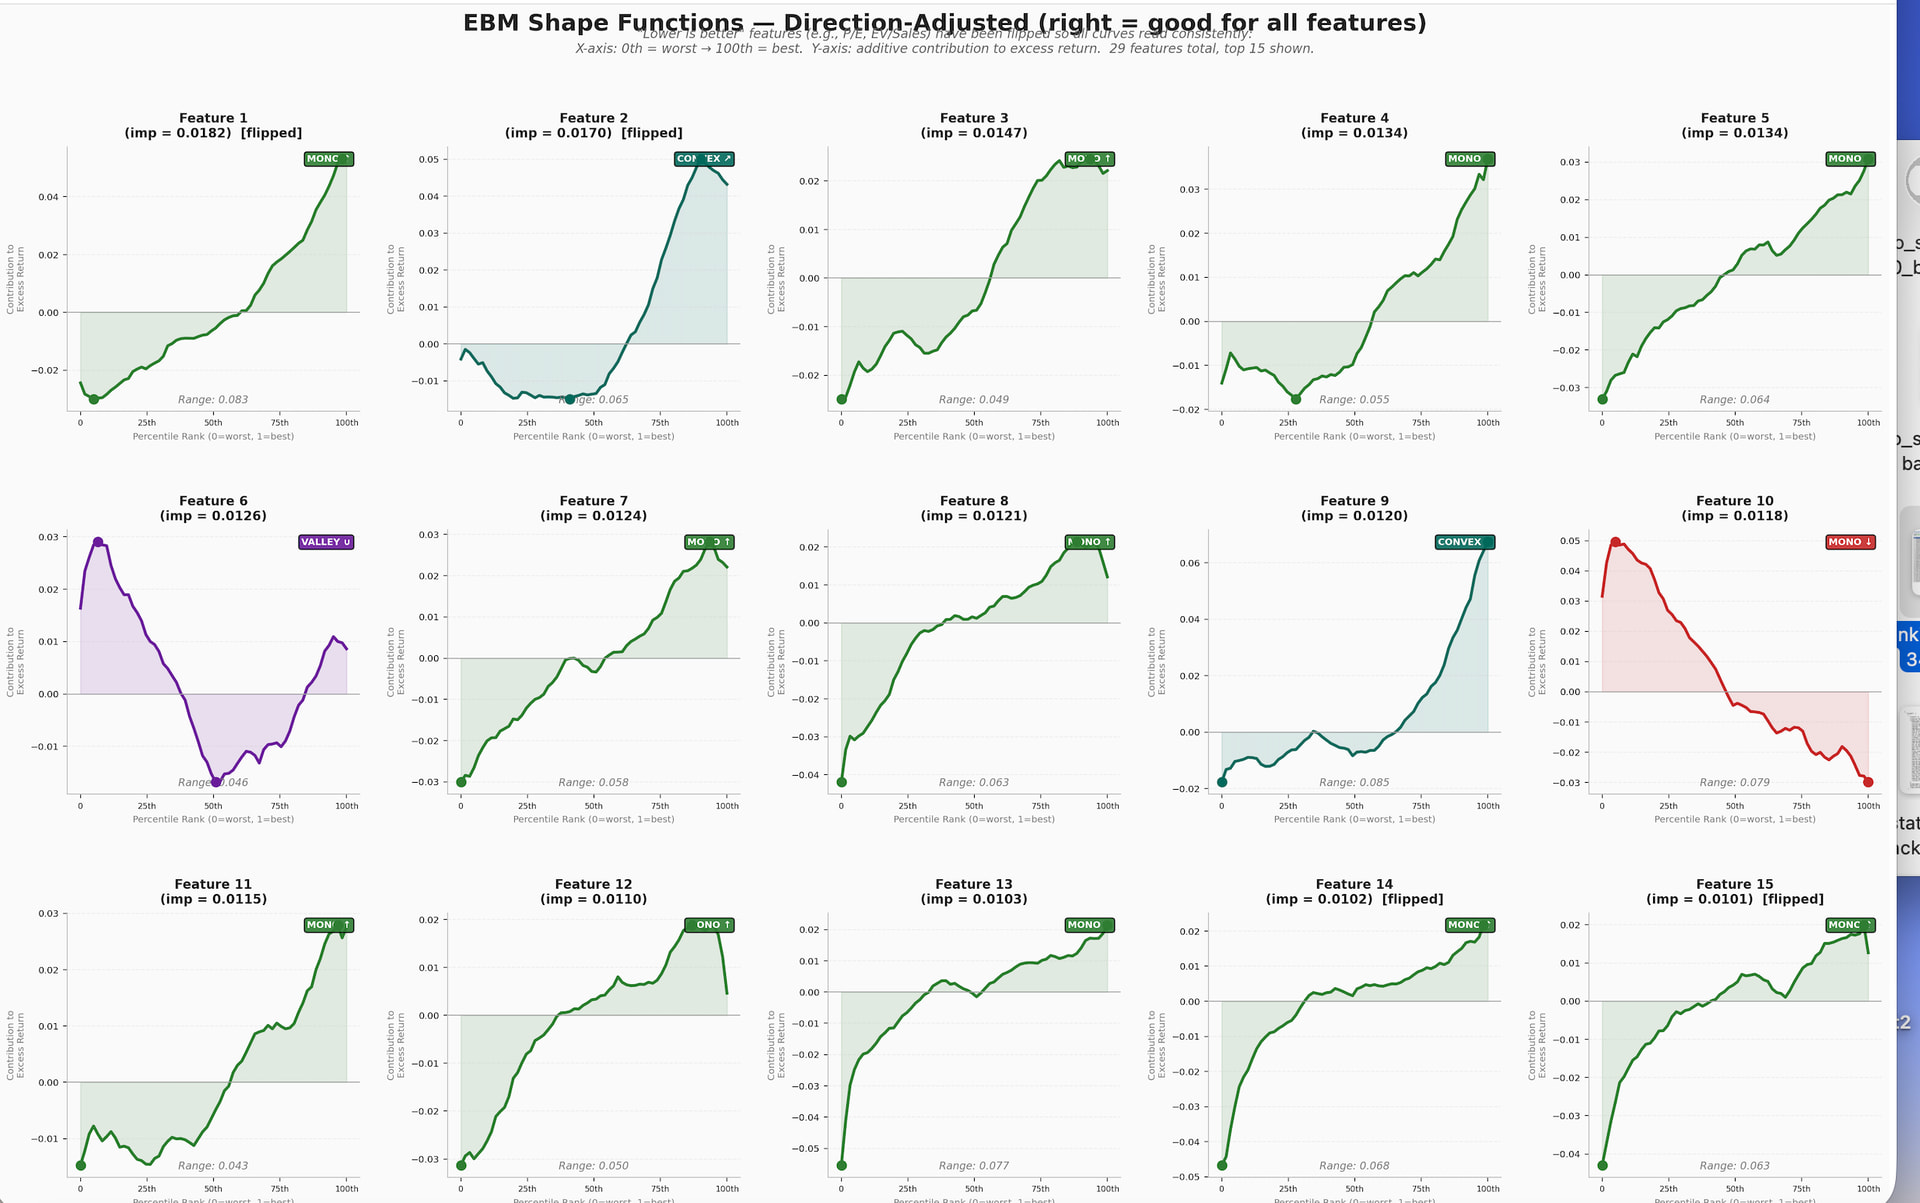
This is an Explainable Boosting Machine which is considered to be a Glass Box Model. So we can see how linear the contribution of each feature is in the context of the total model. These features are all monotonically increasing in a P123 rank performance test for single features!!!
2 features (Feature6 and F10) are probably not helping my linear models. Feature 12 may be helping but it might do better in a non-linear model that takes into account the curve at the end. Feature 10 has a monotonically decreasing contribution to the model and is almost certainly hurting my linear model.
Here is how Claude explains this:
Also worth clarifying: you say the features are "all monotonically increasing in a P123 rank performance test as single features" — that's their univariate behavior. The EBM shapes are conditional on all other features being in the model simultaneously. A feature can look monotone alone but take a different shape once you control for correlated features. That's a key insight worth calling out
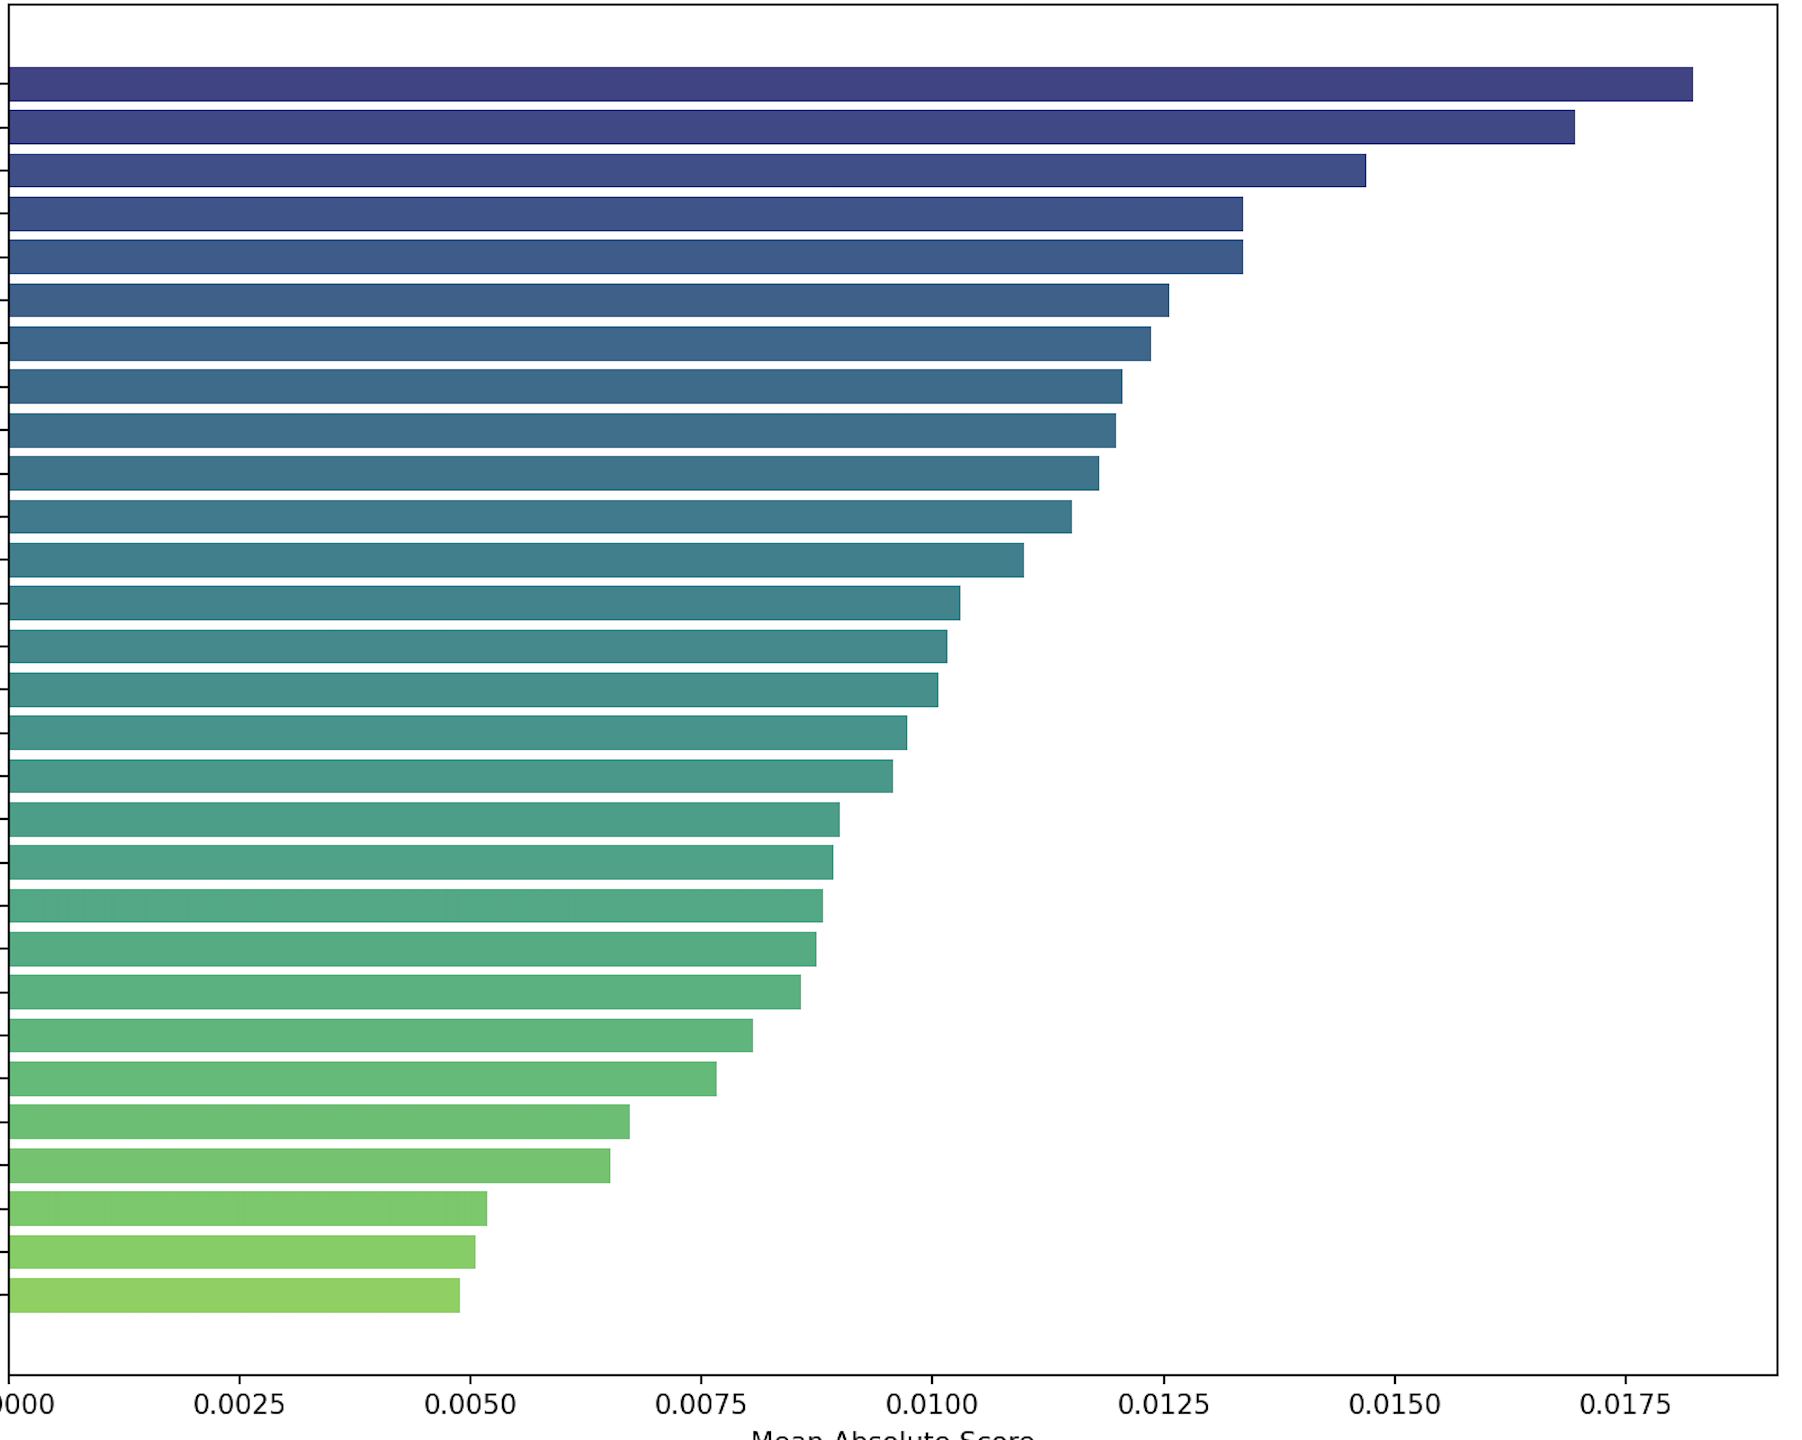
BTW Explainable boosting machines give a feature importances output:
P123 could look at having Claude Cowork integrated into its platform. As it is, anyone can get Claude Cowork to integrate into P123’s API now. Non-programmers can do this easily with Claude Cowork’s help.
Generally P123 might continue to open up the platform. My compliments to @marco as to what he has done in this regard so far. Starting with downloads and the API, integrating AI/ML into the platform and now moving to Apps.
Maybe EBMs can be used to find exceptions to the assumption of linearity or of monotonically increasing behavior within linear models. That could be one of its uses and maybe someone will create an app for that specific purpose.
BTW. I had to edit the data above. The assumption of monotonically increasing behavior within models is not as harmful as I first posted. In fact, it may not a bad assumption in general.
Maybe EMBs can be used to find features that are harmful in linear models and it may be a good transparent, stand-alone predictive model too.
Great question! This gets to the heart of EBM’s claim. Is it as good as boosting with transparency? Unfortunately, I have not run LightGBM with the same features to make a comparison.
Anthropic/Amazon are doing some interesting things for sure! As far as the hardware wars, I find it interesting that Anthropic uses TPUs, GPUs and Trianium chips. Seems like NVDIA’S GPUs are always in the news but TPUs have some interesting features.
Anthropic uses Amazon’s AWS as you mention. AWS uses a lot of Trianium chips. Designed by Amazon but manufactured by TSMC.
I find this interesting, but I would not begin to know how to invest in any of this myself.
Just buy Amazon! They own 15-19% of Anthropic and also process via AWS. Plus massively investing in more cloud capacity due to sold out demand. Imagine what will happen once video takes off. Video is usually much more intensive than text and I am already seeing video explode
So interesting to see Claude doing this level of work so early in the AI cycle. The next 5 years will be wild
This is super interesting, but I don't agree with your conclusion. You can't really apply results from a tree based system to a linear ranking system. I don't know what features you have in the ranking system, but my suspension is that what you see is the result of multicollinearity rather than the feature has an inverse slope.
I vented my thoughts with Claude, and this is his response.
Feature 10 and Multicollinearity — You're Onto Something Important
This is where your intuition is really sharp, and I think you're largely correct.
In the EBM's round-robin boosting process, features are fitted sequentially to residuals. If Features 3, 7, and 10 are all highly correlated, and 3 and 7 get fitted first in the cycling, they absorb most of the shared predictive variance. By the time Feature 10 gets its turn, it's fitting to what's left over — and that residual signal can look completely different from Feature 10's standalone behavior. It could even flip to negative if Feature 10 is a slightly noisier proxy for the same underlying factor. The EBM is essentially saying "given that I already have Features 3 and 7, the marginal residual of Feature 10 is negative." That's a conditional statement, not an absolute one.
In a manual linear ranking system, you're right — if you place two highly correlated features next to each other and give both positive weight, they both push the ranking in the same direction. You're double-counting the same signal, which reduces efficiency (you're "spending" model complexity on redundant information), but it doesn't hurt you the way the EBM shape suggests. The composite rank just overweights that factor theme relative to others.
Thank you very much for your thoughtful and informed response. I actually missed your reply earlier this morning while I was working through this with ChatGPT. Somewhere along the way ChatGPT started discussing your response. So I am still working on this and am sure I do not have a final answer yet.
The specific feature in question (feature 10 that is monotonically decreasing) is forward EBITDA/EV.
I agree that multicollinearity is clearly part of the story. At the same time, I’m exploring whether there may also be a true interaction or moderator effect. I don’t have a firm conclusion yet—still learning whether EBMs can be helpful and if so how.
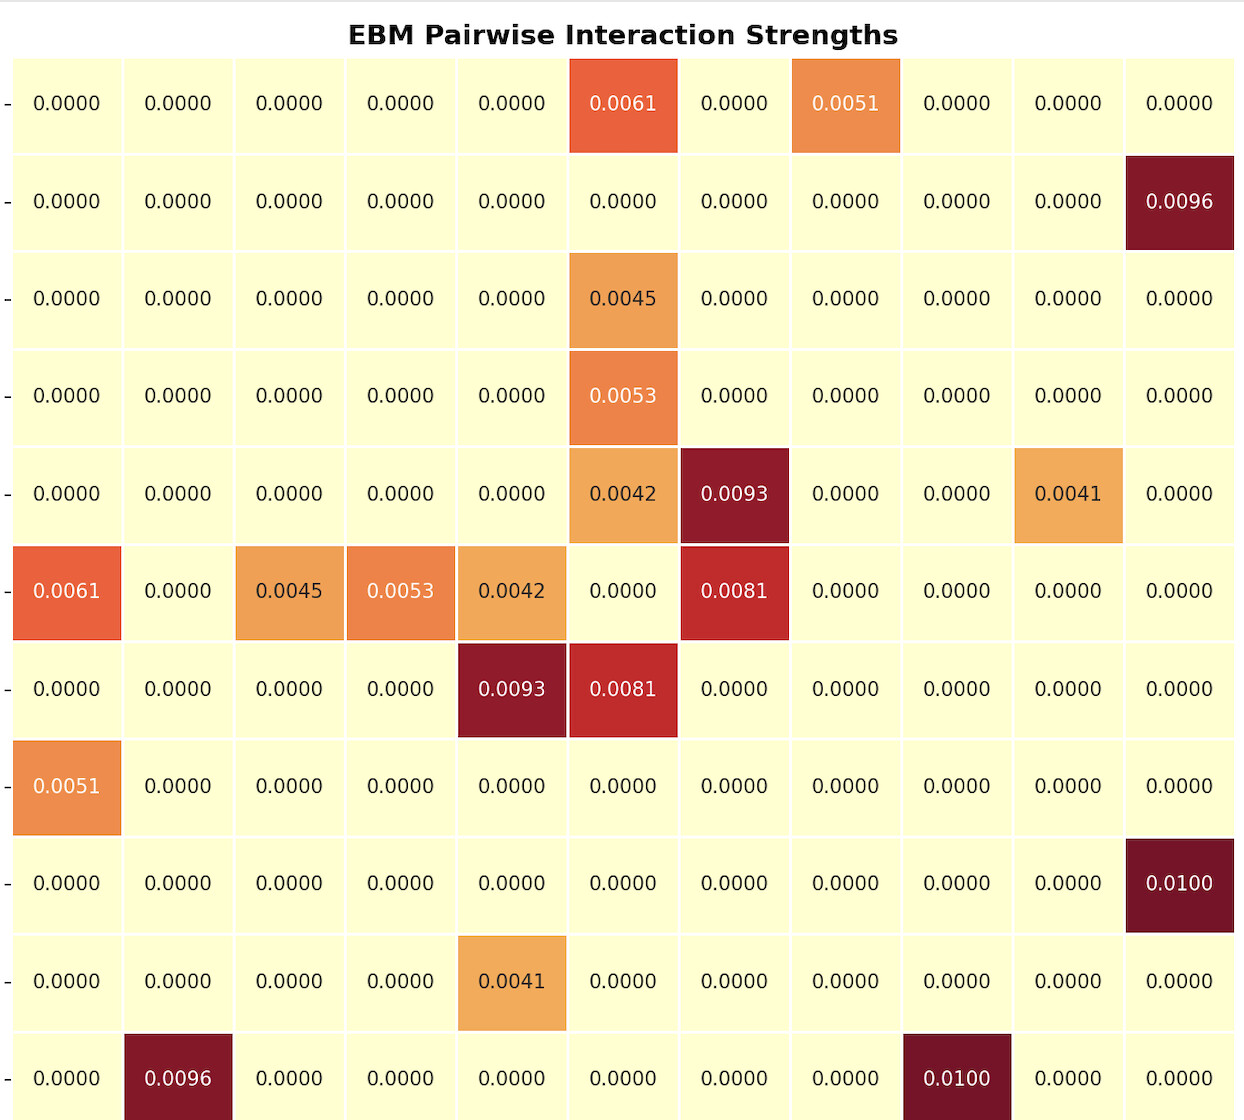
One interesting aspect of EBMs is that they can estimate pairwise interaction strength. In this case, forward EBITDA/EV shows a measurable interaction with EBITDAQ/EV (a core value metric already present in the ranking system). In the heat map, that interaction appears at the far right, second square down. Most other feature pairs show little interaction, which by itself is interesting. Here is the heat map with most features masked:
I’m also trying to think through a causal interpretation. If we are already selecting companies where EBITDAQ/EV is high, then an even higher forward EBITDA/EV might not indicate “more value,” but instead suggest expected earnings deterioration—in other words, a possible value-trap. So EBITDAQ/EV may not only be correlated with forward EBITDA/EV, but could also act as a moderator of its effect.
This is speculative, and I am still trying to sort through this.
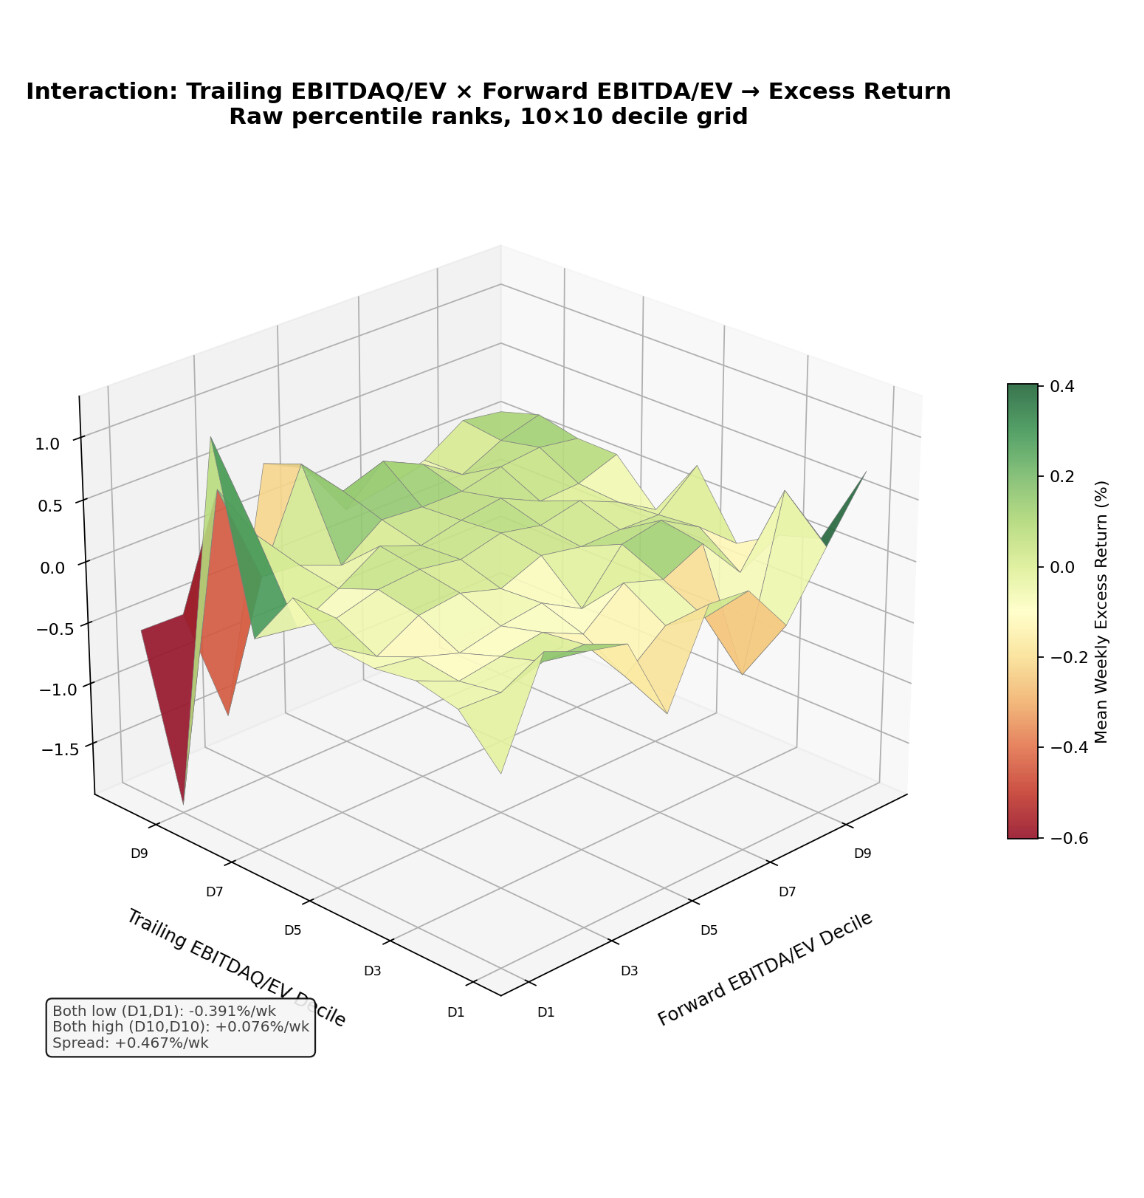
I thought I might look at another visual after considering that the EBM pairwise interaction heat map claims EBITDAQ/EV interacts with Forward EBITDA/EV. Two features interact if and only if the 3 dimensional graph is not a hyperplane. So I thought I might look at this 3D graph:
So with the EBM other feature are interacting too. Therefore, 2 features may may different and not be as clean as the shape curves above. But even here we can see that that the returns are largest when EBITDAQ/EV is large and forward EBITDA/EV is small. And that it is more a bowl than a plane. And probably not a hyperplane with even more dimensions and interacting features.
So perhaps title should be: There goes my hyperplane assumption. That might be fully accurate.
Good thought!!! A lot is the answer!!! I did impute those with random() as we discussed in another thread. It still had the same EMB-produced 2D shape curve. I did not check it with the 3D graph.
Estimates might not fully account for accelerating qtr recently experienced. Does the pair do a lot better if you rebalance more often? You can look at subsequent revisions historically to validate my hypothesis
So not sure that this is a direct answer to your question. But my present model uses both features and I think I will keep both. I think if I have shown anything at all in this thread it’s that we are dealing with a potentially very irregular “manifold” and not a hyperplane. And not a 2D EMB shape curve either.
If you take a slice of the above 3D manifold above where x = y there is a nice gentle monotonic increase through that slice. Exactly what you want and maybe what is happening with most of the stocks. So for more common situations that you encounter, having both features in your model may be exactly what you want.
But a rank performance test uses a projection of an n-dimensional manifold. A manifold that may not always be so regular. Information is lost when you do that and it will never be perfect for all situations–even if it proves to be very useful as a model.
So putting this into perspective. ExtraTreesRegressor is meant to find that Value Gap Anomaly. And I suspect it finds this anomaly easily. But how would I know? It is a black box after all.
But interesting that we can see EBM did find the anomaly: interaction of these features. Maybe EMB deserves to be called a Glass Box.
But equally interesting is that most features do not have pairwise interactions.
I have always thought that ExtraTreesRegressor underperforms because it overfits to an near infinite supply of of interactions. Actually not infinite but it is greater than “n choose k” = n!/k!(n -k)! possible interactions where k is the depth of the tree. Not infinite but pretty large and and that is just for one tree.
In my mind EBM still has the unproven potential to:
identify interactions. We have seen that already.
limit the interactions. Remove spurious interactions. EBM allows one to turn on or off pairwise interactions.
Use a non-linear model that is not limited to flat hyperplanes.