Hi all,
I want to look at the spread between valuation multiples for the highest to lowest rank stocks in an index. I seem to be getting an error when trying to use UnivAvg with a more complex formula.
I was thinking that the chart would show something like this:
However, i get an error “invalid command “EV2EBITDATTM”” - is this due to trying to use Frank in the aggregate series formula? I also am just realizing that having a formula showing Frank<10-Frank>90 may just show the absolute rank numbers subtracted from each other (e.g. rank 10-rank90 = -80) rather than for example 200x EV/EBITDA - 10x EV/EBITDA = 190x.
Any suggestions on the best way to set up this formula?
I used 9 because that’s the median EV2EBITDATTM over the last 20 years using the United States (incl ADRs and dual-listed) universe and a market cap > 50. But if you’re using a different universe, the median might be a little different. It shouldn’t matter very much.
Now this formula doesn’t produce a very useful chart because the average can be extreme when stocks have very low EBITDAs. So a better formula would be
@yuvaltaylor How can we do this with ranks of ranking system? I.E. rather than call EV2EBITDATTM, we call the Core Value System and take the average return over x days of the top decline minus the bottom decile?
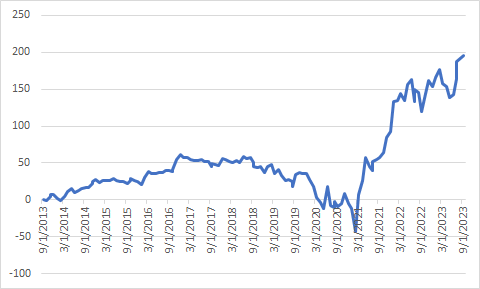
You can use Excel to chart this. Click on the Performance tab, then next to “Chart Type” click on “Performance.” Run the chart with 10 buckets. Download the data (the down arrow above the chart). In cell N13 type =L13-C13. Copy that down the whole way. In cell M13 type =A13 and copy that down the whole way. Select columns M and N and then click “Insert” and choose a 2-D line chart.
I’m afraid there’s no way to do this using Aggregate Series.