I am a beginner at using the screening language and any help is appreciated.
I get an error when trying to use a variable in the loopmax function to calculate the high unadjusted close price for CY 2022
I set a variable for number of bars in 2023 to use as an offset in the loopmax function.
@FY23off : BarsSince(20221231) // trading days in CY 2023, use as an offset in loop
@Hi$22 : LoopMax(“CloseExDiv(CTR)”,251,@FY23off,1) // Max Close price (unadjusted) for year
I get error "ERROR: Invalid criteria in Rule 19. Invalid parameters for LoopMax "
I have tried both "@varname : function " and SetVar(@varname, function) variable naming conventions.
The loop max function works when I enter value instead of the variable.
Dale
1 Like
It’s a very bad error message. It should say “Parameters for LoopMax must be constants”. In other words you cannot use variables or functions. The settings for the LoopMax function are only initialized once and there’s no way to know that what you are using doesn’t change from one stock to the other.
We need to: 1 ) fix the error message 2) introduce the concept of a “constant variable”, like SetConstVar()
In the meantime, why do you need unadjusted (for future dividends) close prices? If you can use adjusted this works
@h22:HighVal( 251 , BarsSince(20221231))
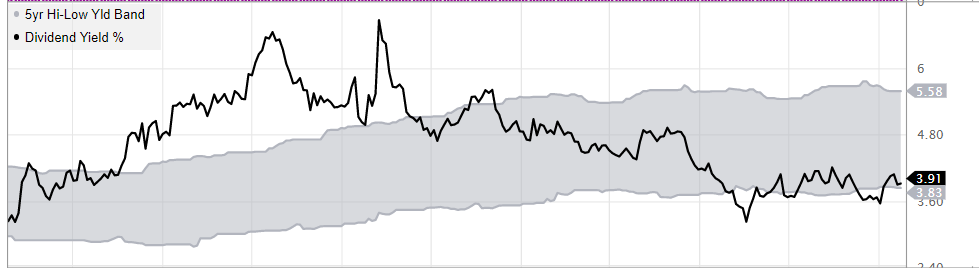
Thanks Marco. I guess my next question of a loop inside a loop doesn’t exists yet either. I am trying to calculate a 5 yr average Hi and Lo dividend yield to use a a valuation for dividend paying stocks. Therefore, an unadjusted price is needed (at least in my mind). I do have a version using HighVal, so I am trying to contrast the differences. So a loop inside a loop, with the outer as a loop average over 5 yrs and a loop max (or min) on the inner loop would get the answer in essentially 1 command for max and another for min.
Not sure what you mean by " 5 yr average Hi and Lo dividend yield" . Do you mean 5Y hi and lo yield? Why the “average” ?
These are reasonable factors , and we should have them pre-built. We have Yield5YAvg (monthly samples) so it should be very easy to add for example: Yield5YMin, Yield5YMax, Yield3YMin, Yield3YMax, Yield1YMax, Yield1YMin
There are also these ways to calculate min/max yield. You can’t do it for 5Y because it can only do up to 156 weekly iterations, or three years. It’s silly. It should allow you to go back further, maybe by doing sampling every 4 weeks. We’ll make some quick changes.
@min1Y:FHistMin(“yield”, 52) or @max1Y:FHistMax(“yield”, 52)
@min3Y:FHistMin(“yield”, 156) or @max3Y:FHistMax(“yield”, 156)
PS. not sure why the thread started with calculating the High for 2022, is it related? Are you trying to calculate the min/max yield every calendar year?
Sorry, I got confused by our own documentation. To calculate the 5Y Min/Max Yield is very easy:
FHistMin(“Yield”,65,4)
FHistMax(“Yield”,65,4)
The 65 is the number of samples, and 4 is the weekly offset. So 65 * 4 = 260 weeks, or 5 year span.
I am defining the low yield for a year as the Annual Dividend divided by the High Price for a given year. Likewise, the High Yield is the annual dividend divided by the low price. I calculate those ratios for the last 5 years to derive a high and low 5 yr average. This sets upper and lower limits to evaluate the stock valuation based on its current yield (forward dividend /last price). The Hi22 variable is just 1 of the 10 needed to calculate the average 5y hi and lo average yields. I saw the FHist commands, but haven’t spent the time to fully understand their usage and wasn’t completely obvious to me on how to incorporate. I guess I was locked in on using yearly data vs looking at a set of samples over the same timeframe. your example is something that I will try. Thanks for the follow up.
You might want to create two custom formulas:
$5YAvgHiYld:
Avg(FHistMax("Yield",52),FHist(`FHistMax("Yield",52)`,52),FHist(`FHistMax("Yield",52)`,104),FHist(`FHistMax("Yield",52)`,156),FHist(`FHistMax("Yield",52)`,208))$5YAvgLoYld:
Avg(FHistMin("Yield",52),FHist(`FHistMin("Yield",52)`,52),FHist(`FHistMin("Yield",52)`,104),FHist(`FHistMin("Yield",52)`,156),FHist(`FHistMin("Yield",52)`,208))Then your final formula would be
(Yield-$5YAvgLoYld)/($5YAvgHiYld-$5YAvgLoYld)
1 Like