X
Be very careful about use of Interest Expense. Companies can be very inconsistent in the way they report/bury it, to the point where you may often see companies with Interest Exp that seems very high relative to the debt they report or very low (or even zero for companies with debt). Consider using Eval statements to substitute a heuristic cost of debt when the computed one is out of whack. There may also be oddities caused by the fact that Interest Exp is a running 265 day total while the debt item is based on just a few daily snapshots.
Similar issues may impact preferred.
With setvar, we have more flexibility now. For example we can easily start with the 10year treasury and establish spreads for each capital item.
Example:
SetVar(@DbtCost,(close(0,#tnx))*2/10)
SetVar(@PfdCost,@DbtCost+1)
setvar(@CostEq,@DbtCost+3)
then, you can have @WACC equal to weight of debt time @Dbtcost + … etc.
What’s interesting though is that it’s not clear how sensitive stock prices are to getting the best possible WACCs. For another project, I did a lot more work with WACC including having built a p123 algorithm based on an academic factor model. The latter is super when viewed on an individual company basis; answers reasonably consistent with common sense. Oddly, though, when I plugged WACC into other factors that use it, such as EVA or FGV, I found better performance with less sophisticated approaches to WACC. Perhaps the market has given up the ghost on cost of equity which, no matter how one slices it, is necessarily going to be a fairly artificial assumption.
Marc,
Have you found any solution for incorporating WACC and EVA as ranking factors?
Since EVA is inherently subjective (with the inputs for “WACC” and adjustment to GAAP Income), this problem is best solved by mapping more data elements to the GUI and letting users duke out how best to solve the problem.
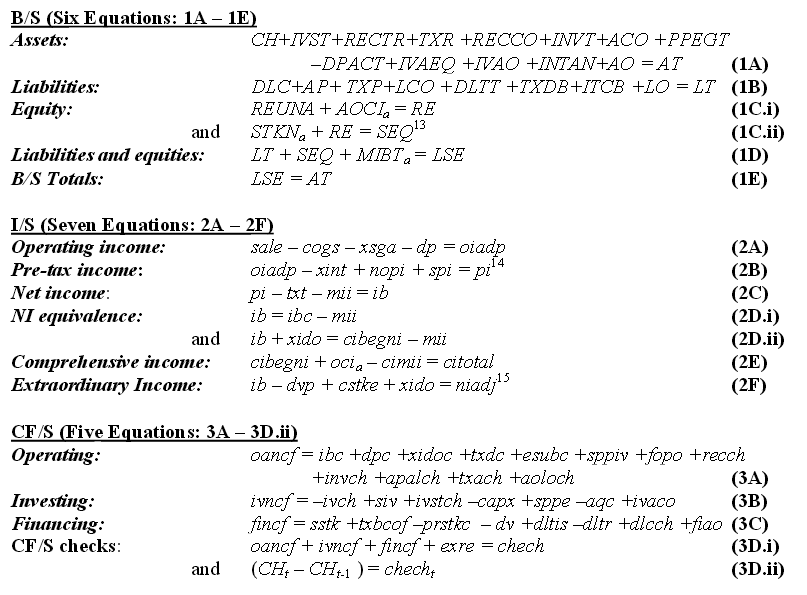
Staff, please considering filling in all of the data elements which are included on page 12 of the UofI paper but not yet accessible through P123, “Do Compustat Financial Statement Data Articulate?”
These formulas are captured below:
primus,
interesting paper. Thanks for sharing!
Scary findings of deviations from what would be expected (close to 10%) - and they only examined S&P 500 companies, which might be comparably more transparent than their smaller cap counterparts.
They have analysed 24 years of data, we “only” have 16 (which is the more recent part of it). I hope and think that data consistency improves with time.
Best,
fips
Actually, yes. I’m somewhat tied up until the end of the month, but in December, I’ll figure out what it would take to do it and offer up some ideas – which may turn out to be the posting of a draft or a version thereof of the WACC chapter from a book on which I’m working.
One of the intriguing (liberating?) things I found in my research is that performance results of models that use factors dependent on WACC showed surprisingly little sensitivity to the costs of each capital item (assuming the assumptions weren’t ludicrous). The main sensitivities seemed to be to the capital structures.
Given character limits in custom formulas and our inability to use one custom formula inside another, I found Showvar coding to be the best way to get it done on p123 so those who are interested in using WACC may want to get comfortable with this functionality (which, as I said before in other threads, I believe to be the most powerful but also most underrated tools in the p123 arsenal).
I had at times considered spec-ing a p123 WACC function, but I’m not sure that would be the best approach considering how much seat-of-the-pants work goes into WACC (cost of equity is the killer; the CAPM formulation that I once thought might be usable is actually a disaster in practice). We can talk about it later on.
That’s great, thanks.
I’ll revive the thread in December then.
Agreed, Marc. CAPM is best left in the Ivory Towers.
Did anyone ever come up with a nice, compact way of expressing cost of equity without using beta (CAPM)?
I am also interested in calculating the market value of existing debt using P123 data (not just using the balance sheet info).
Just curious.
Really, the only way to do it is to pull a number out of your head.
When I want to add some discipline to the process, I start with something we know, a treasury rate such as #TNX, the 10-year. I add a number to get an assumed cost of corporate debt. Then, I add again and assume that’s the cost of preferred. I add another number to get a cost of common. I did something like this when I needed a number for computing Noise (in the virtual strategy course).
Another approach: set cost of equity to dividend yield plus expected growth rate. Not sure it will work company by company from the data but you can look into it.
There really is no hard-core statistical way to do it because cost of equity is based on expectation and any data we use will be powerfully impacted by the specifics of the sample period from which it’s drawn, which for any individual stock may vary from highly representative to spectacularly aberrant.
Here’s my wild stab at this. First, I’m just using 8% across the board as the cost of equity, a completely arbitrary number, but I don’t know if I can do better; and I’m using 35% as the tax rate. So here are my custom formulas:
$costofdebt: IntExpTTM/(AstTotQ - PfdEquityQ - ComEqQ)
$wacc: MktCap/EV0.08 + DbtTotQ/EV$costofdebt*0.65
$nopat: OpIncTTM*0.65
$eva: $nopat - $wacc*(AstTotQ - LiabCurQ)
The next question is what to do with this. I like the performance of EVA per share to price. It works well in my microcap-heavy universe, though I don’t know if it would work very well with large caps.
If anyone has suggestions for improvements or uses, I’m happy to listen.
This one could become a problem.
The easiest way for it to go wrong would relate to the fact that the Q items in the denominator reflect a singe day. A lot happens to debt items on days other than Mar 31, Jun 30, Sep 30 and Dec 31. So at the absolute minimum, you need to replace Q with TTM, but that’s only four days so even that might not work.
There are also an amazing variety of weird accounting things that could distort the IntExpTTM item. I couldn’t even begin to explain them, but if you study a lot of companies and dig into 10-OK and 10-Q footnotes to see who you’ll sometimes see $costofdebt working out to clearly bizzare numbers, you’ll see w3hat I mean. I tried a formula like that, but as I looked at individual companies and followed oddities into the footnotes, it became apparent to me that a heuristic interest rate assumption is the most workable.
Here is some Cost of Capital data by industry by Aswath Damodaran.
At Shaun’s request, I removed the spreadsheets that he was attaching. You can find them at Prof. Damodaran’s site at NYU.
Shaun, thanks for the suggestion. I hadn’t seen these spreadsheets before–they’re terrific!
Here are my revised equations now, after doing a lot more thinking and research. And thanks to Marc for showing me that I was thinking about cost of debt all wrong.
$costofdebt: 0.65*Avg(Close(0,##CORPBBB), Close(0,##MORT30Y))/100
$wacc: MktCap/(EV+CashEquivQ)0.08 + DbtTotQ/(EV+CashEquivQ)$costofdebt + PfdDivA/(EV+CashEquivQ)
(I’m using EV + CashEquivQ for the sum of the market values of equity, debt, and preferred stocks.)
$nopat: OpIncTTM*0.65
(Ideally I’d be doing things like amortizing R&D expenses in calculating NOPAT, but heck.)
$eva: $nopat - $wacc*(AstTotQ - IsNA(PayablesQ,0) - IsNA(LiabCurOtherQ,0))
The most valuable thing I’ve learned from all of this is that the cost of equity is invariably greater than the cost of debt. That had never occurred to me before, and it has fundamentally changed my way of thinking about cost of capital. We focus so much here on how bad debt is, but we rarely consider how much cheaper it is than equity!
I’ve been reading some of what Joel Stern wrote about EVA. The man basically invented free cash flow in 1972, and then EVA a few years later. His brilliance is stunning.
As for what I can do with all of this, $eva/(Price*SharesFDQ) seems promising, as does $eva/AstTotQ. This is basically substituting EVA for Net Income in earnings yield and ROA. It seems to conform to the goal that Stern had when he came up with EVA as an alternative to EPS and called it “economic profit.”
What worries me, though, is that I haven’t found anyone else using these ratios . . .
I would multiple the PfdDivA/(EV + CashEquivQ) by say costofdebt + .01 or average of cost of debt and cost of equity
Yuval, I also thought these metrics would be more widely used, but as you have seen, they can be tricky to calculate accurately. I use them a quality measure due to the inherent inaccuracies. The idea is that a company that is adding economic value is well run all other things being equal.
The actual cost of preferred equity is PfdDivA/PfdEquityA, and the portion of capital that is preferred equity is PfdEquityA/(EV + CashEquivQ). So in multiplying the two, you get rid of PfdEquityA.
And that’s a good thing because the numbers in the database are often completely wild. For example, P123 gives PG preferred equity of NEGATIVE 243 million (which is more or less the amount it paid in preferred dividends last year), and GE preferred equity of only 6 million (while it paid out 656 million in dividends).
/quote]What worries me, though, is that I haven’t found anyone else using these ratios . . .
[/quote]
That’s because cost of capital is horrifically hard if not impossible to precisely calculate (as folks here have been seeing) and because so many are so fearful of the crucial art of approximation.
But the formulas I’ve seen in the last few posts look pretty good and quite usable. There is always room to come up with more variations, but I think this thread has now produced some approaches that are good to go. And that means interesting approaches like EVA, or my noise/vale thing, and others that require a cost of capital assumption are open to you.
By the way, once you get going and have some models that make use of this, try fiddling around with cost of capital and re-testing. When I’ve done this, I noticed that the performance of the models was not all that sensitive to the cost of capital formulations – they were more sensitive to getting the balance sheet allocations. In other words, it’s more important to recognize the differences between a 25/75 deb/equity split versus a 65/35, then it is for the the cost of equity for the 75 or 35. I’d be curious to find out if others see the same with your models
Yuval, has the move to factset altered your use of these any?
After 3 years, do you still feel these are as useful in the mico universe?
Thanks
Tony