Shiller’s point is CAPE and 20-year market returns are correlated. I may be wrong, but I don’t think he claimed CAPE is mean-reverting to a constant, did he?
1 Like
Oh, I meant that in terms of making a DIY time series with P123 data.
P123 might populate SP500 time series data (e.g., SPEPSQ, SPEPSCNY) going back to 1989. This date is to sync up 10 years before P123’s first PIT fundamental backtesting data.
Fred,
I would have to re-read his book since it has been many moons since I did last. However, that is my claim (hypothesis, actually). I’ll examine the data and run a best-fit when I get a chance this weekend, but it’s pretty obvious from the chart that the data is mean-reverting. After all, nearly all financial data series are mean-reverting, which is a source of excellent excess returns for those who recognize and exploit it…
I pose again my last question:
Any ideas?
Yes, there has.
-
cash flow accounting makes it more difficult for companies inflate earnings:
“In 1987, FASB Statement No. 95 (FAS 95) mandated that firms provide cash flow statements.[8] In 1992, the International Accounting Standards Board issued International Accounting Standard 7 (IAS 7), Cash Flow Statement, which became effective in 1994, mandating that firms provide cash flow statements.[9]” -
mark to market accounting forces companies to write down assets losses
“Statement of Financial Accounting Standards No. 157, Fair Value Measurements, commonly known as “FAS 157”, is an accounting standard issued during September 2006 by FASB, which became effective for entities with fiscal years beginning after November 15, 2007.” -
earnings yields are related to interest rates:
Invert the CAPE-10 and subtract out the 10 year Treasury or Corp Bond Yield, and you’ll find a relatively stationary time series. This is, in my opinion, a TRUE cyclically adjusted equity risk premium. Jim can run a Dickey-Fuller test to validate these tome series are cointegrated of order 0.
Higher CAPEs are here to stay awhile.
Potential catalyst for change continue to be changes to accounting rules (there may be others… who knows?). It is likely that regulations will continue to compel companies to report more conservatively, even though the prospects for investors are unchanged.
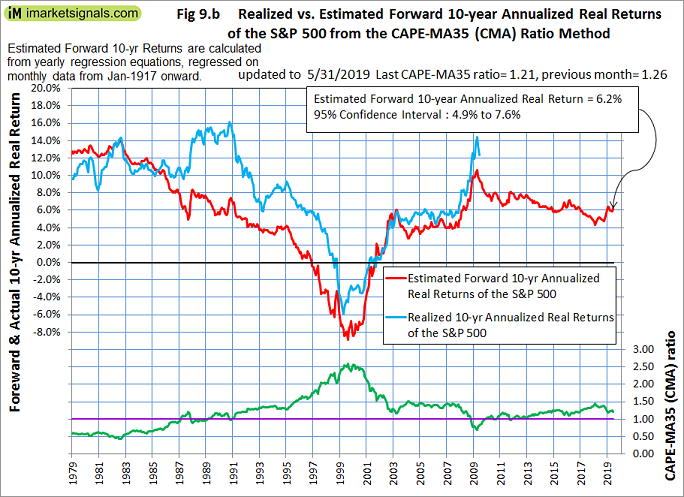
I don’t like the standard method of judging S&P500 valuation according to how much the the value of PE10 (CAPE-ratio) is above the long term average of PE10. I use a 35-year moving average instead of the long-term mean. That, in my opinion, should adjust for changes in accounting standards, etc. over time.
Then I calculate the ratio PE10/sma(35-yr PE10). This CAPE-MA35 ratio gives a much better picture of stock market valuation.
https://imarketsignals.com/2019/beyond-buy-hold-shiller-cape-ma35-ratio/
End of May 2019 the CAPE-MA35 ratio was 1.21, indicating that the stock market was reasonably priced, and the expected real 10-yr forward return is about 6%.
A CAPE-MA35 ratio less than 1.0 is a screaming buy signal. Check the 2009 level of this ratio and the 10 yr annualized return that followed.
Primus, you forgot to mention that the Securities and Exchange Commission was only established in 1934 to regulate the commerce in stocks, bonds, and other securities. … The Securities Act of 1933 required public corporations to register their stock sales and distribution and make regular financial disclosures.
So before 1934 it was the “Wild West” and any company data must be highly suspect. That’s why it is nonsense to calculate a long-term mean of PE10 with data from 1871 onward (as Shiller does) and to use this mean today to judge stock market valuation.
Wowza! What a great chart, Georg!
Excellent point, Georg.
That’s a good point, also. The theory I was proposing is that the extent that stocks are overvalued or undervalued is a significant factor affecting the scope of the subsequent selloff (reversal downward from extreme overvaluation) or rally (reversal upward from extremely oversold conditions) after the reversion-to-mean begins.
By that I mean, the selloff will be much worse after stocks have reached extreme overvaluation – either in vertical loss or time loss. Consider the -90% downturn after the 32.56 reading in September 1929 (which was, by far, the record-setting all-time-high for 71 years).
Moreover, after a 1,380% gain in the 18 years preceding the reading of 44 in December 1999 (dot-com bubble), stocks were in a sideways consolidation with two crashes of -50% for the subsequent 13.5 years, before they gained any ground again.
The level from which we measure to determine extreme over-valuation is open to debate, and I agree, a long-term moving average makes much more sense than the average from 1871. However, the 35-year average of the 10-year average may be too long to see shorter-term periods of extreme overvaluation – such as the 33.31 we saw in January 2018 – after a 321% gain in 9 years. That’s a slightly higher valuation than Black Tuesday, 1929.
Of course, there are many other factors that come into play that affect the extent of a selloff. For example, the 2009 crash was a credit-related crash, which historically is more severe than other types of downturns. Also, the Federal Reserve has been able to fight recessions in the modern era with lower interest rates, while that wasn’t done in 1929. On the other hand, at 2% on the 10-year today, that’s not much ammunition.
Other perspectives?
I used the 35-year moving average of the CAPE-ratio because it would contain at least 3 business cycles. A shorter MA would not do that.
The January 2018 level of PE10 when referenced to the 35-year MA was not such a big deal. The CAPE-35MA ratio was then 1.5, still signalling real 10-yr forward returns of about 4%. Not great, but no reason to panic.
No reason to panic, unless we are soon headed into a long-overdue recession, don’t you think? (That’s still no reason to panic, but you get the point, I hope.)
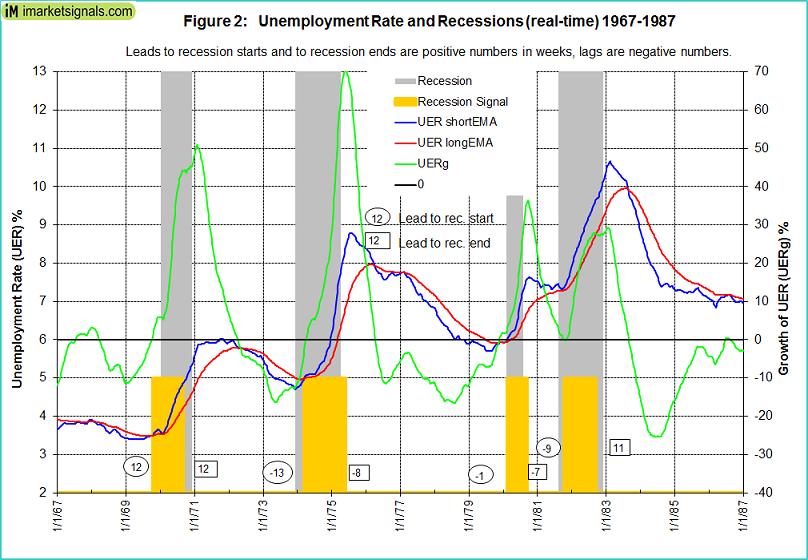
With a number of well-established recession indicators (two easy examples being unemployment and the yield curve) at levels where they have nowhere to go but in a direction that indicates the beginning of an economic contraction, that January 2018 CAPE high at 33 may have marked the top of the market for this cycle.
With Initial Unemployment Claims flat at 220k for a year, Continuing Claims flat for 6-7 months, and the Unemp Rate at 3.6%, the economy has been running at full capacity for some time now. Unemployment at a flat-line low always precedes the upturn, and that is one of the harbingers of economic contraction, declining sales and earnings, and lower stock prices – resulting in a bear market.
Sure, fractional new highs have been set in the S&P 500 by a few points in the last 17-18 months, but IMO it looks highly likely that we’ll see a -20% bear market before we see another 20% rally. Are 4% real returns still possible over 10 years? Of course, since the average recession only lasts 6-18 months and we’re talking about a timeframe of 10 years.
But that recession could cost investors -56% and require 5.5 years from which to recover before there is a 4% return 10 years from now – almost exactly the same parameters as the last 10 years. I know your indicators are not signaling the recession in the next 11 to 12 months, but I keep watching for a turn that could happen at any time. My models are ready to automatically switch to positions that will profit regardless of the direction, but it’s always fascinating to see it play out in real time.
Just my 2₵. What’s your take?
Not sure how to be subtle, but reading through this thread makes me more convinced than ever that those who say its useless to try to predict and move ahead of recessions/bear markets is a useless endeavor. Here are just some of the problems I see with long-term historical analysis:
-
CAPE itself: There’s no way I’m going to give CAPE more predictive implications than does the guy who created it, and he’s never been more than iffy. And although it’s been a while since we introduced CAPE into p123, I do remember having had a hard time with the numbers because, as it turned out if I recall, Shiller was not removing unusuals from the EPS used to compute the ratio, meaning the sereis is much less stable than a serious indicator (which he never said it was) should be.
-
The Fed: With every fiscal and monetary self-proclaimed genius building political brand and page clicks by talking about how nobody on the planet is dumber than the sitting Fed chair, the reality is that for quite a long time now the Fed has done what historians of the future will describe as an incredibly good job managing the economy and monetary system and accomplished, if not the death of the business cycle, then at least a huge stretching of expansions and a remarkable ability to contain and reverse conflagrations. We probably have to re-think the whole inflation-unemployment thing and during the course of my career, I’ve been through six market situations (1981-2, 1987, 1994, 1998, 2001-2, 2008) any or likely all of which, had they occurred before WWII, could have sparked a jump-out-a-window lose-your-savings type panic and in more than one case, a 1930s style depression.
-
Globalization: Before the 1980s, we measured the US economy and things like rail or steel strikes had the potential to cripple everything. Now, we think in terms of global economy of which the US is just one participant (however much Trump longs for the old days, nothing he says or does can change the fact that they are gone), thus casting severe doubt on any model that does back more than a decade or so.
-
Technology and productivity: This, in a sense, is part and parcel of the whole inflation/globalization phenomenon. Historical relationships between a unit of input and a unit of output need to be confined to museum archives. As to working servers, they should just be erased.
-
Politics: Isn’t it obvious the broad political pendulum continues to swing and that after a generation of swinging rightward, its now turning to the left and will continue to do so regardless of the result of the next election. It’s also swinging away from the liberal democracy trend that had dominated much of the post WWII period. Its hard to say how this will impact markets’; a left shift might actually work better tha many expect if it doesn’t get out of control. At the end of the day, profitable business needs well-heeled customers and the right-dominated trends may have gone to far in anti-customer approaches (class war is stupidity - the worker from 9-5 is the customer from 5-9 — balance is best, anyone winning means everyone losing).
-
Exogenous influences: Seriously, does or can anybody think that what happens to the US economy and markets within a plausible investment horizon will, for better or worse (and darned if I know which one) be influenced by what movers and shakers, none of who are likely to have the capacity to spell GDP, do and say.
So whenever I see a forecast and citations to data or charts, my reaction is WTF!
As to what I expect . . . See the slogan below my e-signature. I continue to stand by it.
I say: “The proof of the pudding is in the eating.”
You can follow our Business Cycle Index (BCI), which does not signal recession yet. When it does and no recession follows then Marc’s assertion that it is a useless endeavor will be proven correct. So let’s see what happens. We will dig up this post when we are closer to the next recession. Currently we are in the “boom phase” of this business cycle, after which inevitably comes a recession.
Check back to 1969. Unemployment at a record low 3.5% by the end of the year (lowest since 1948, and lower than the current rate), but that did not stop the 1970 recession beginning in January, and unemployment at 6% one year later.
The BCI is updated weekly on Seeking Alpha.
No good and I have no interest in looking at you charts. Past track records of prediction are NEVER proof of anything, especially if one says that a boom phase is followed by recession. That’s as exciting as saying a broken clock (non digital) is going to be right twice per day, or like predicting that stocks will change prices tomorrow (I predict they will). For a prediction to be worthwhile, we need to know when, how bad and in what form (since each its in a different way).
BTW, anyone want to subscribe to my NBA forecasting tool. I just created it this morning. It predicts the Toronto Raptors will upset the Golden State Warriors in the finals. ![]() $$$$$$$$
$$$$$$$$
Marc, I know you are not interested in my charts, and that’s o.k.
But it would be nice if you guys could keep the #SPPE10 current on P123 because Robert Shiller’s cyclically adjusted price–earnings ratio has served as one of the best forecasting models for long-term future stock returns.
The problem is that #SPPE10 is still a valid P123 function which can be used in simulations and the unsuspecting user (namely me) had no idea that this indicator in one of the buy rules had not been updated since 2014.
Marco has updated the three Shiller ratios (Earning, Dividend, and PE10) available in the MultiChart area so that the data goes through to recent months. We pulled the data from Shiller’s site. It will be available for simulations tomorrow. Warning: this is not point-in-time data. Shiller revises it from time to time.
Thank you so much. CAPE is a monthly series based on monthly average of S&P 500, Earnings and inflation rate. I calculate it myself using a blend of EarningsTTM and S&P 500 Earnings and Estimate Report - S&P Dow Jones Indices.
Thank you, Marco. This will be very helpful, Marc’s entrenched opinions notwithstanding.
We don’t really need to automate updating this , or many others like it, on P123 (which takes a lot of time to maintain and possibly needs expensive licenses).
We will soon allow users to import their own time series with a new feature called ‘User Factors’. One way to import data will be using spread sheets which is time consuming and error prone. Will also support more automated ways, for example using http requests with your own API_KEY. For example Shiller PE10 is available on quandl using this request:
https://www.quandl.com/data/MULTPL/SHILLER_PE_RATIO_MONTH&api_key=YOUR_API_KEY
With our new User Factors , all you would need to do is create one, give it a name, and set it to automatically load the data on a predefined schedule using the above address (to get your own private API_KEY all you need to do is signup on quandl).
This should work for all providers that use htpp + API keys. Licensing is also not an issue since the user licenses directly with provider.
Thanks.
Thank you Marco, this will be a great addition to P123. Looking forward to this being implemented.
Amazing news! Thanks Marco.
You have probably thought of it: it would be great to specify the series time unit for the “bars” parameter used in all functions.
Just as an example (maybe not smart), I was thinking of importing 3 series of the Baltic Dry Index in daily, weekly and monthly bars. Hope this will be possible