My understanding is that the rolling test uses x number of shares for each period that are the highest ranked. The next period does the same, putting together the next x-number of stocks that are the highest ranked. Each period is summed up as net performance (not annualised), which in turn constitutes an average for all the rolling periods at the bottom of the test. This offers some advantages:
Positive:
You avoid timing luck to a certain extent, because the return is net and only constitutes an average
You avoid that a single stock has a large effect on the return. Both because the stock that have done the best can disappear in the next rolling period, and the return is an average.
It is a very quick test to run if many tests are to be run on a system. For example, if every node in a ranking system is to be tested.
The negatives:
It is an unrealistic approach to how a portfolio is normally put together
Although average return takes away some of the noise, it is still a poor picture of reality
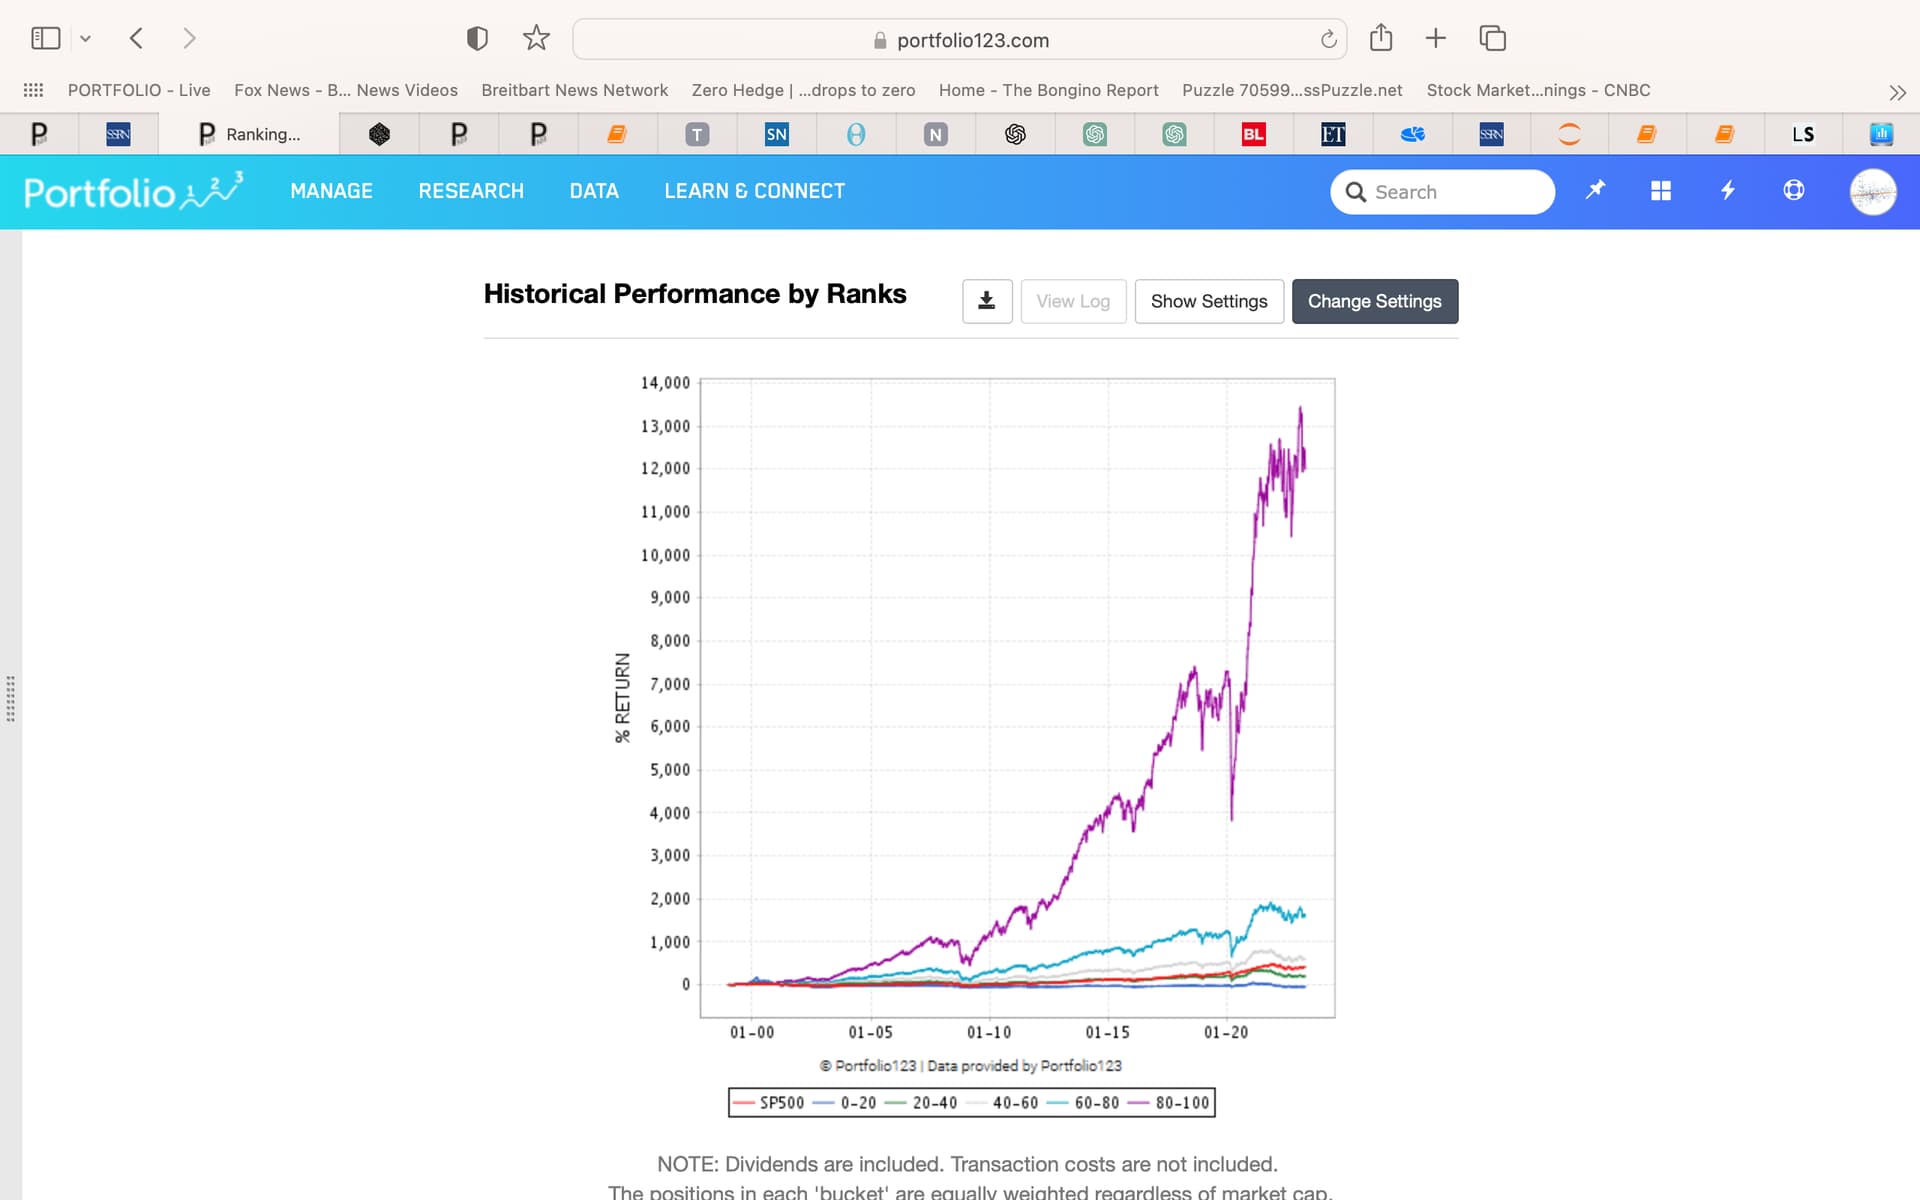
Performance test - Rankiung’s systems:
Here the principle is much the same as above. Each period holds top-ranked stocks, and is fully rolled over at each period. However, the return is annualized.
Positive:
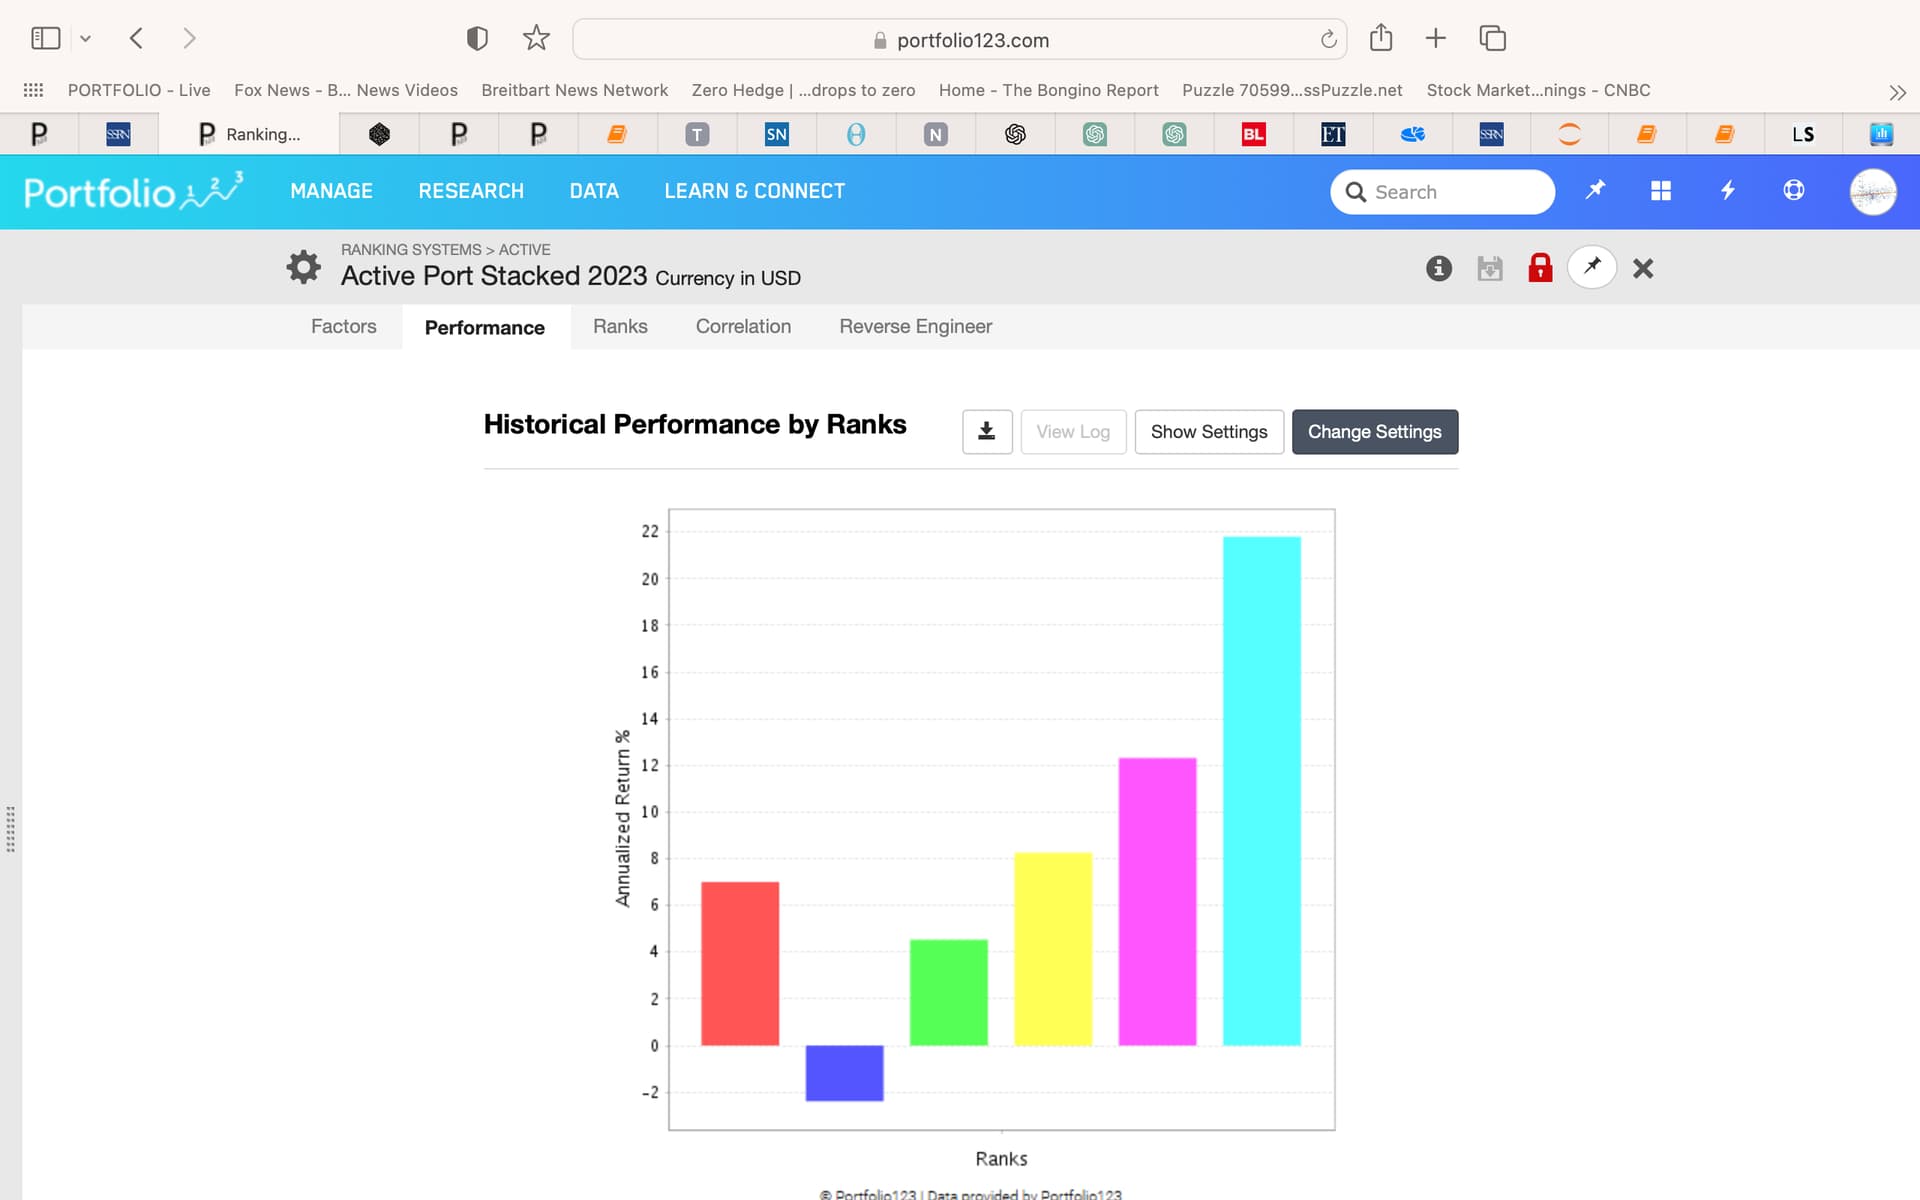
The test gives a good visual picture when using buckets, how the system performs in the highest buckets
The same image also shows how vulnerable the system is if e.g. if there is no progression in the buckets from the lowest to the highest score
Negative:
because an annualized return is used, if the number of buckets is too high, individual shares can have a large effect
It is not possible to see how the profit is distributed over the entire period
The timing luck effect can cause more noise in this test, because with annualized returns, a high return at the start of the period, gives a high reinvested capital from the start, that again will give the impression that the system is better than it really is.
If the bucket number is set too high the test is very sensitive to individual stocks
You do not have the same control over the number of shares included in each bucket
takes longer to run than rolling test
Is this wrong? Are there other negative or positive effects that make you want to use one of the two systems in optimization and robustness testing, or not
Personally, I think that the main advantage of using rolling backtests is that you get a larger sample when you are using longer rebalances.
Most people already understand this, I think—although I tend to forget the advantages for longer rebalances when the topic comes up in the forum. As an extreme example if you have a yearly rebalance, starting the backtest each week of the of the first year is a clear advantage. You clearly get a much larger sample. About 52 times larger (a little less).
For weekly rebalances a rolling backtest of a sim does give you the worst drawdown that you would have experienced if you had started a port at the most inopportune time. So it is good for finding the extreme ranges or returns.
For weekly rebalances, bootstrapping can also be useful for finding ranges or confidence intervals for the returns
Rolling backtests are definitely a useful tool. Especially for those using longer rebalances, I believe.
The tests work on different components and provide different insights into system behavior.
The rolling test works on a portfolio and takes multiple samples with fixed duration and incrementing offset. I don’t think averaging is involved. For each pass, the results (return, excess return, alpha, etc) are tabulated and then finally plotted. It’s great way to see when alpha occurs. Ever have a sim where the equity curve is far above the benchmark and yet the most recent years performance is poor? Run a rolling test. Most likely, the alpha tab will show that all the alpha occurred in the early years and little most recently. It’s the early years that provided the equity curve “lift”. This would be useful in a DM presentation, too. I typically set duration to one year and offset to 3 months.
With the Historical Performance by Ranks, the rolling test time-series information is lost. But you do get some idea of how effective a ranking system is at discriminating good from poor performing stocks. Since the Performance tab provides an equity curve for each bucket, it would be interesting if that could be combined with a rolling test, So instead of, say 20 equity curves, one could get 20 alpha curves. One for each bucket. However, since the number of holdings in a bucket is typically much larger than those in most strategies, it’s unclear to me how representative those alpha plots would be. It would also require a simulation setup. Ok, forget that idea.
I think most of the positives/negatives you listed are accurate. However, both tools should be used anyway.
Thanks Jim, I modified my reply to limit that to roll test time-series. With one equity curve, one gets one alpha value. With a rolling test, there are multiple, shorter duration equity curves and one can get multiple alpha values that may be plotted over time.