What is the most cost-effective way to do machine learning with P123 data?

TL;DR: The answer to the above question, I think, is you can download data that is updated overnight using the API or if you rebalance weekly you can use Data -> Download factors. You can then use that data at home to make predictions with machine learning using your own computer or Colab. If you are just looking for the most cost-effective way to do machine learning at P123 for most people you can safely ignore the rest of this post.

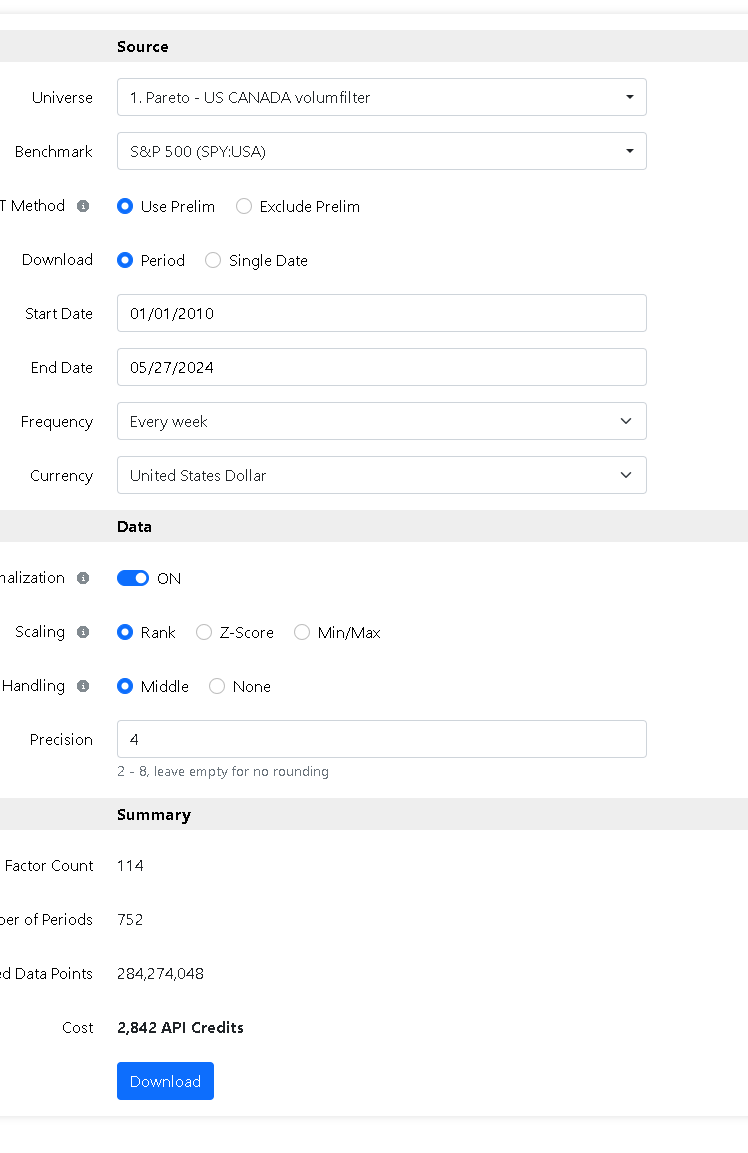
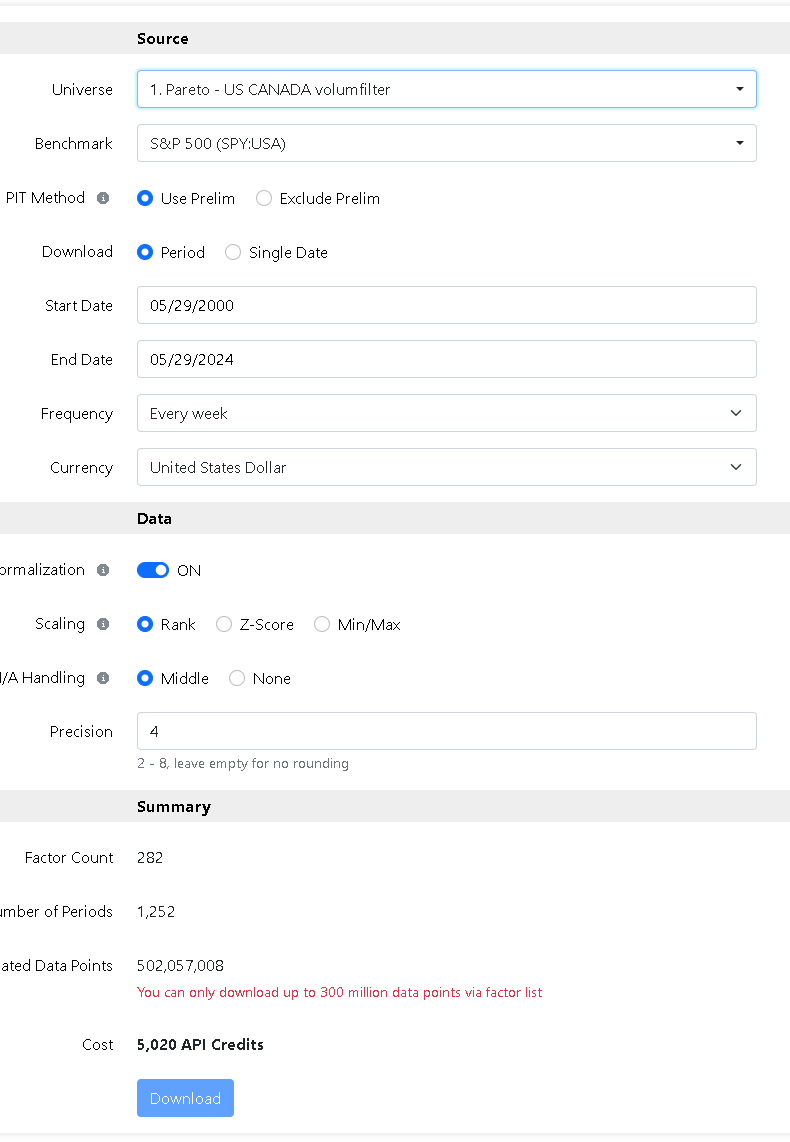
This method is well-summarized here:

So again, you can just stop here if you want to know what will be most cost-effective for most members. You already have that. But here is a rough—back of the envelope--assessment of the costs for this method versus using P123's AI/ML for those interested in some numbers.

I am not an accountant (or programmer), but member cost for using downloads:

  1. Home computer and/or Colab, AWS or other provider which many already have.

  2. API credits with Ultimate membership. The Ultimate membership probably providing enough API credits to rebalance and do some training. Maybe the purchase of some API credits during initial training will be required.

  3. Some member programming time setting up the API to rebalance (as detailed above by Pitmaster). People can asses the value of their time without me.

P123 cost:

  1. The cost of providing the API downloads which is often billed to the member or part of one of the higher memberships.

  2. Considerable reduction in the use P123 servers no matter how members might substitute outside computer resources for P123 servers using the AI/ML or P123 Classic.

Of course, P123 will be releasing a new AI/ML option.

P123 member cost: Can be summarized as $1,200 per year additional cost is now being considered by P123.

  1. Minimum of $1,200 if you train a model and want to fund it. $1,200 if you want to rebalance it, in other words.

  2. Probably an Ultimate Membership if you want to train a model but an Ultimate membership is probably necessary to use the API method also, so not necessarily an additional cost when comparing the 2 methods.

Cost to P123:

  1. Mainly increased cost for any increased use of the present servers that create sims and rebalance. The new severs cost $1.50 per hour and some of this will be charged to the P123 member as resource units so that is not a significant expense from what I understand.

Savings:

  1. So most of the training, at least, occurs on a server that costs $1.50 per hour and this is charged to the member as RUs (resource units), so some of this cost is billed to the user. Some RUs are provided with an Ultimate Membership. Members will not be using the Sim Servers as much. But they may move over to the Sims for their training of models at some point. Not 100% sure how that will work. Rebalance, for now, seems to involve the more expensive servers and be extremely costly for some reason that I can quite figure out (my lack of programming skill being the obvious reason). In any case, rebalancing is the primary cost to the member and I assume it is associated with significant cost to P123.

So this can be summarized (again) as: Pitmaster's way will save me $1,200 per year. I already have a machine that can do this at home with the API. There are a few things my machine cannot do. Support Vector Machines do not run fast enough, for example. But I will have complete control over the program at home as an advantage separate from the costs.

Or course this assumes a person believes there is a real, practical benefit to machine learning and has a desire to use it as a member or someone considering becoming a member has a desire to do machine learning

I note that Yuval is pretty computer savvy (at least knows P123's programming better than almost anyone). And can crunch the numbers to know what works for him and the factors he used. I assume someone was there to help him with things he was not familiar with.

AND I do think someone can actually do machine learning (using Python programs that are generally called machine learning by most people) to optimize the rank weights in P123 Classic and that seems to work for me. Call that whatever you want. I don't care about the name as long as it works and is automated. Plus, rebalancing P123 Classic is easy in addition to being less expensive.

I am not in charge of marketing but I think P123 will need to attract new customers who already have an appreciation for machine learning to succeed. Maybe they will remain committed to machine learning while reading the forum. The present members are not likely to give it adequate support in the forum or be convinced to pay the additional price themselves. See above quote from P123 staff that is a reflection of much of the sentiment P123 members have at this point in time, I would guess. To be clear, I think it was an honest assessment by an advanced user and I don't disagree that P123 Classic works for many people including me.

For new members interested in machine learning specifically, it will be $3,200 per year (counting the Ultimate Membership) to just try machine learning with the AI/ML. And even then, they would have to have just the right level of programming skill (or lack of programming skill) to chose the AI/ML over using the API. Some will move to P123 classic eventually for various reasons.

While machine learning at P123--as well as many features including k-fold validation--may have been my idea originally, I only made a feature suggestion for the downloads (specifying the array for the download in my posts) which can be done now with the API. The idea that ranks could be used for machine learning was not accepted for a while by P123. I was not consulted by P123 about the AI/ML offering, ever. I am not arguing against my own ideas is the point. However, I do think a different price structure--creating a demand from new customers who actually believe in machine learning with their posts reflecting that appreciation in the forum---will work well for P123's AI/ML offering long-term. But none of that is guaranteed.

From what i understand about the AI/ML Marco has done an excellent job with it. I think that it will work well, has advance capabilities (e.g., an excellent, state of the art, method of cross-validation) and it will be easy to use--even for those not experienced in machine learning now. I will gratefully take advantage of the AI/ML offering when (not if) the cost/benefit ratio is clearly in favor of doing so.

Jim

2 Likes

Great post, and I agree. The challenge for us newer to this game is learning Python coding to achieve maximum machine learning capabilities outside of what the P123 platform will offer.

I've found ChatGPT incredibly helpful so far, and I've been able to achieve solutions with Python and Colab that I thought would take months.

However, I see you consistently discuss ML in your posts, and you seem to handle both the coding and testing methods well. Would you be willing to share some of your Python code you sue for ML on "use Data -> Download factors"?

It would be extremely helpful.

1 Like

Note: In the code below, adjust n_jobs to the number of parallel processor you can use with your own computer.

You have been fooled. I like the math and can do a proof. Some machine learning thought-processes are similar to a mathematical proof. But frankly, programers (and mathematicians for that matter) need to do more these days.

One of the things I hope to never learn (not fun for me) is munging or wrangling data. I thought slicing truffles or tuples was something I would learn in culinary school. :slightly_smiling_face: Uh, maybe those are inscrutable or immutable anyway? Can you slice them?

But seriously I hope you will not need to rely on my slicing the data or even creating a for-loop. Maybe you can even help me with that part.

Here is much of what you actually need for the machine learning part, however. I would consider not revealing it and keeping it a big secret. Except it is about the most basic thing one could ever talk about in machine learning and is common knowledge over at Kaggle say. I think this will allow you to start ALONG WITH A CROSS-VALIDATION METHOD that I or someone else can help you with in another post.

#Hyperparameters can be changed here:
criterion = 'friedman_mse'
max_depth = 15
min_sample_leaf = 150
min_samples_split = 150
max_features = 'sqrt'
n_estimators = 500
bootstrap = False

# Library and Module imports:

import pandas as pd
import numpy as np
from sklearn.ensemble import ExtraTreesRegressor
from sklearn.metrics import mean_squared_error
from sklearn.metrics import r2_score


#Train over a set of data that you can munge into an array (X,y). X is the factors and y is the target or Label that Azouz and Pitmaster talk about: "often future returns."
regressor = ExtraTreesRegressor(min_samples_split = min_samples_split, bootstrap = bootstrap, n_estimators=n_estimators, min_samples_leaf=min_sample_leaf, max_features= max_features, criterion=criterion, random_state=1, oob_score=False, n_jobs=8, verbose=0)

#Fit the model

regressor.fit(X,y)

#make some predictions on some new data. X_test is just the same set of feature in (X,y) above but with new data.:

df['Predicted 1wkRet'] = regressor.predict(X_test)

For now, line up your predictions of what will happen df['Predicted 1we Ret'] with what actually happened (the actual returns) in a spreadsheet.

You can do a lot with the spreadsheet. Things you are probably already doing (like correlation of the real returns and the predicted returns). DO REMEMBER these are returns for individual stocks and not aggregated buckets. Expect the correlations to be quite small. Maybe even think that 0.04 over the entire data set might be meaningful. Remember also this correlation is for all stocks and not just the ones you will be ultimately be buying in your stock model.

I am sure I missed a step or two but it is a start and perhaps others can help fill in the blanks. I think this code can be copied and added to. Perhaps in this thread. With no need to repeat what has already been said said by me here: "jinne really is unable to code very well" I have ChatGPT too, BTW. I have been able to make this work with some additional code (often provided by ChatGPT),

Send this code to ChatGPT, as you already know to do, and you will be up and running quickly, I think.!!!

Jim

Thanks, it worked, but I had to run it through Chat GTP a few extra times before it worked the way I wanted.

I will start publishing the code when I get closer to a model I'm a bit more satisfied with.

What I see when I start trying to get help with coding from GTP is that there are often many rounds of working on the data. There are often errors in the data, or it doesn't quite understand the file I've uploaded beforehand. That takes a lot of times.

Do I understand correctly that all you do is download the file as a CSV and use it as is without pre-processing it?

If I download a lot of data, I assume the file will become very large. As I've set up the code now, it uses uploading:

Upload file

uploaded = files.upload()

But how do you solve this when the training datafiles that is large? Do you point the code to a file located on GDisk, or on your local PC?

If you have large datasets, you still use Colab? wouldn't it be easier to use something like Microsoft Visual Studio? Or no difference?

Yes, all the data is normalised except for some fields that can be download in raw format, like future returns or volume. You can skip normalization for e.g., 'Future%Chg_D(20)' and normalise in your own way. I would suggest to download a small portion of data to check how it works.

You will not be able to download labels for sectors, but you can do some ML tricks to approximate sectors in your sample for the purpose of diversification.

2800 API credit should translate to ~2 GB. It should fit to RAM easily. I like to use Jupyter Lab for data analysis and VS Code for coding framework.
Once your framework is coded you can even create graphical GUI. One easy way to accomplish this task is Jupyter Widgets library: Jupyter Widgets — Jupyter Widgets 8.1.2 documentation

An Excel csv file has a limit of 1,048,576.rows as you may know. So an Excel csv file holds more than 3 years of data for an Easy to Trade Universe.

I download seven 3-year Excel csv files into folder on my desktop. After uploading the csv files into Jupyter Notebooks I can concatenated them into one file.

I am sure can create larger csv files that are not Excel Files but I did not create a single file on my desktop. Multiple files makes programming my 7-fold validation method easy and it was not really a problem to concatenate the files (one line of code) in my Jupyter Notebook once the files are uploaded..

I have not used Colab much So I cannot help with it. But I do create one file called 'df' here in the code: df. df is often used to mean a DataFrame in Pandas which you probably know. But pandas makes some of the manipulation easier (import pandas as pd). I think you probably know this but it is an important part of managing files, I think, if you you re not familiar.

Here is how i uploaded data into one file to be to be trained. Later I "test" or predict returns for df1 in this code. Note that this gives me what is called an "embargo period." In other words, I do not train on data immediately after the test period. Train df3 - df7 leaving out df2 in the training. Test df1.

When you iterate this (concatenating df1 and d4 - df7 for training and testing df2 etc) you can both train and test ALL OF YOUR DATA. You average all of your test data for each setting or hyperparameters (or features used) and find the settings or hyperparameters that give the best average result. This is k-fold validation or 7-fold validation in this example. Different from training after 2008 and testing before 2007. Not necessary better but a different way to do it.

BUT if I'm going to do it seven times it needs to be automated for me (to some extent).. Even if I wanted to do it all (with a spreadsheet and the optimizer) I couldn't be that organized with my time. And even if I could do it, maybe I could have tested a couple other models with that time.

I also included code to create a row with excess returns if you are not already doing that. I think it is crucial to use excess returns as your target.

import pandas as pd
df1 = pd.read_csv('~/Desktop/DataMiner/xs/DM1xs.csv')
df2 = pd.read_csv('~/Desktop/DataMiner/xs/DM2xs.csv')
df3 = pd.read_csv('~/Desktop/DataMiner/xs/DM3xs.csv')
df4 = pd.read_csv('~/Desktop/DataMiner/xs/DM4xs.csv')
df5 = pd.read_csv('~/Desktop/DataMiner/xs/DM5xs.csv')
df6 = pd.read_csv('~/Desktop/DataMiner/xs/DM6xs.csv')
df7 = pd.read_csv('~/Desktop/DataMiner/xs/DM7xs.csv')
#df8 = pd.read_csv('~/Desktop/DataMiner/xs/DM8xs.csv')
df = pd.concat([df3, df4, df5, df6, df7], ignore_index=True)

#The other thing is this. Do you know how to create excess returns relative to the Universe? I think as a target or label you might want to use excess returns. Fortunately you have alls to the reruns in your data and this can be calculated. Here is the code to create a row of excess returns in your csv file (to buy used as target in your code):

[code]
import pandas as pd

# Read the CSV file
df = pd.read_csv('~/Desktop/DataMiner/DM8.csv')

# Ensure that the "Date" column is a datetime object
df['Date'] = pd.to_datetime(df['Date'])

# Calculate the mean returns for each date
mean_returns = df.groupby('Date')['Future 1wkRet'].mean()

# Subtract the mean returns for each date from the individual returns
df['ExcessReturn'] = df.groupby('Date')['Future 1wkRet'].transform(lambda x: x - x.mean())

# Now, df['ExcessReturn'] contains the excess returns for each ticker and date
[/code]

Jim

Pitmaster: “You will not be able to download labels for sectors, but you can do some ML tricks to approximate sectors in your sample for the purpose of diversification.”

For your ML tricks are you clustering by relative performance or do you have another trick you are willing to divulge? If you have access to another historical data source that includes sector information you could merge the data but is probably too much effort for the potential gain.

An article on Using clustering techniques to enhance stock returns forcasting.

Data vs. information: Using clustering techniques to enhance stock returns forecasting - ScienceDirect

1 Like

Right, I cluster stocks according to sector funds and financial ratios.

1 Like

Which setting is best to use?

Do you need data "every week" to do good enough training, and have enough data, or is every second week good enough?
Do I understand you correctly that you divide the datasets into several smaller download periods so you come around the limitation in "Estimated Data Points"?
Does this also the machine learning process simpler afterward?

I look forward to any insights from Pitmaster and Bob. They really know what they are doing.

  1. So I think you have to do this if the download is an Excel csv file. You will exceed the
    1,048,576 row limit of an Excel file if you try to download a full 20 years at a time. There are multiple ways to get around that. I did it once to get a large file into JASP so I know it can be done. Sadly JASP could not handle that much data and I cannot remember exactly what I did. But I think I used Python to upload the Excel files and download a csv file that was not an Excel file onto my desktop. ChatGPT can fill in the details of this or other methods. AND if you use Google Drive it may not be a problem at all. It is a problem with Excel csv files for sure.

  2. So I don't mind it because it is easy to upload and concatenate the files in Python. For me personally, it can help me do cross-validation to have 3-year periods already defined without slicing the DataFrame later (i.e., df1, df2,……df7 are already sliced into 3-year periods for me).

I am sure there are many ways to do it but I download 3-years at a time and put each of those into a file on the desktop (called DataMiner in the above code). Concatenate with the above code.

Hope that helps.

Jim

1-week forward label would be very noisy, especially for small caps, and prone to overfit.
It can seem right for me to train model on a longer forward label (3-12 months) to capture longer trends and invest (rebalance) weekly or monthly.

This is complex topic. I have not found yet golden rule.

3 Likes

When estimating rolling machine learning models every month, we find that these models
perform better when the sample size is large and when the dependent variable (stock return) is computed over a long horizon.

1 Like

Thanks. Nice study. I noticed also, that an expanding window performed better in this study than a sliding windows using a number of different periods. Just one study with not that many features in that study, to be sure. I'm not saying this necessarily generalizes to what P123 members are doing. But I continue to use expanding windows and sliding windows (both) in my personal cross-validations. As did the authors.

I agree with pitmaster, have also found that short term target returns are too noisy, I’ve tried 8 weeks(40 days) but the 3M is probably better. Most fundamentals are on a quarterly basis.
The “Persistence in Factor-Based Supervised Learning Models” has some nice data but I’m not convinced that as I interpret their conclusion that only long-term data is valid for ML methods is valid. In addition to the long term somewhat predictable by fundamental financial factors there are additional short term variations that change with every new individual financial report that obviously change the stocks predicted value.
There is obviously a new horizon of testing these contrasting concepts with different factors, different mix of historical data lengths within the P123 community. I’m enthused!

By the way a previous post showed a RandomForestRegressor() without a n_jobs=-1 which lets your processor use all available cores and threads to work in parallel which is many times faster. Try it.

1 Like

Nice tip!!! I agree n_jobs = -1 is generally the best. Certainly the best default for initial coding.

I run code in the background while I use other programs on my machine. I wanted to avoid conflict with other programs. I have 10 cores in my M2 Pro chip (8 high performance cores and 2 high efficiency cores). While I am not sure that I am actually dedicating the high efficient cores to the Python program, that is the hope.

That having been said, the only time I have noticed any significant performance problems, crashes or freezing when using n_jobs = -1 is within the Python code itself when I have specified n_jobs = -1 for the regressor AND n_jobs = -1 for the grid search cross-validation (GridSearchCV).

Thank you.

Jim