It has long been accepted that most models developed with ranking systems on P123 platforms typically only deliver around half of the expected out-of-sample or live performance.
What are your thoughts on the ML models? This is a completely different approach, but what experiences or perspectives do you guys have? Can we expect a similar outcome here, meaning that we can anticipate around half of what we achieve in 'Testing - Holdout' once the model goes live?
Yes, there have been several forum threads discussing this topic. While it may not apply to everyone, many believe that approximately half of the models perform well (half) when coupled with appstrong textropriate backtesting methods.
Moreover, I found some studies that provide insights into the machine learning models, although I have not yet explored all of them:
Gu et al. (2020) - "Empirical Asset Pricing via Machine Learning"
Methodology: Compared various ML models (neural networks, random forests, etc.) to traditional factor models
Data: US equity market, 1957-2016
Out-of-sample performance: ML models achieved a 30% higher out-of-sample Sharpe ratio compared to traditional factor models
Key finding: Neural networks performed best, particularly in capturing non-linear patterns
Krauss et al. (2017) - "Deep neural networks, gradient-boosted trees, random forests: Statistical arbitrage on the S&P 500"
Methodology: Compared deep neural networks, gradient-boosted trees, and random forests
Data: S&P 500 constituents, 1992-2015
Out-of-sample performance: Ensemble of all methods achieved 0.45% average annual return in true out-of-sample period (2010-2015)
Key finding: ML methods significantly outperformed buy-and-hold (-0.25%) in the same period
Fischer & Krauss (2018) - "Deep learning with long short-term memory networks for financial market predictions"
Methodology: Long short-term memory (LSTM) networks vs. random forest, logistic regression, and buy-and-hold
Of course, designers models may not be representative of what is meant by "most models" developed by P123 members in general. And there may be selection bias in those models. For sure some models were listed and then they weren't. Obviously, for reasons that we cannot know in most cases. Maybe some people are removing the best systems for their private use.
But the surviving designer models can be dowloaded and sorted in Excel with 2-year excess returns being the easiest.to do this with. It is just a sort in Excel or Python. People can do this on their own and use something other that 2-year excess returns if they wish. Draw their own conclusions.
I assume almost every designer model had excess returns in-sample before being made a designer model. If one is interested in quantifying the fractional decrease or decline in excess returns out-of-sample this number will have to be a positive number for there to be any mathematical meaning to the answer.
Thank you Marco and P123 staff for providing an excellent, state-of the-art and easy-to-use method for cross-validation and testing with a true hold-out test sample should a member find value in this approach.
Interesting, they argue that even out of sample is often overfitted somewhat because people often choose one out of sample model out of many many out of sample models. Just by testing and looking at several, this increases the risk of overfitting. Some models just get lucky and pickup more background noise.
Another interesting finding (though I forget which study I was reading now - read a lot recently), is that when comparing “shallow learning” neural networks to deep learning neural networks in sample, the deep learning NN has higher performance often, but the shallow learning NN usually has higher out of sample performance. The authors mentioned that deep learning networks have so many layers of complexity that they often can optimize to background noise rather than the underlying signal/factors.
I’ll review some of the studies you posted when I get a chance. Thanks for the resources!
It has long been accepted that most models developed with ranking systems on P123 platforms typically only deliver around half of the expected out-of-sample or live performance.
I think it's better to say that one should not expect out-of-sample results to exceed half of in-sample performance. Why? Because there are always going to be quite a few strategies with negative out-of-sample results. The statement doesn't allow for that.
"I completely agree; I may have expressed myself a bit too categorically. What is crucial, and what I'm curious about, is the experience and research concerning this issue when it comes to the use of machine learning. Can we expect the results to be somewhat better than what is achieved when using rankingsystem and good backtesting strategies, or is it the same out of sample?
Here is something to add to the debate: Real-time Machine Learning in the Cross-Section of Stock Returns.
". The machine learning strategies examined by prior studies use subsequently
discovered anomaly variables as predictors of stock returns and cannot be implemented in real-time.
We construct machine learning strategies based on a “universe” of fundamental signals. The outof-sample performance of our strategies is positive and signifcant, but considerably weaker than
those documented by previous studies, particularly in value-weighted portfolios. We fnd similar
results when examining a universe of past return-based signals. The relative weak performance of
our machine-learning strategies is not due to our ML implementation, as we are able to replicate the
strong performance of machine learning strategies based on published anomalies. Nor is it driven by
the omission of short-term reversal in our predictor set. Finally, we fnd that our machine learning
strategies based on fundamental signals earn positive returns after trading cost, while those based
on past-return signals earn negative net returns. Overall, our results indicate that machine learning
strategies enhance investment performance, but the economic gains to real-time investors from using
machine learning forecasts are more modest than previously thought."
"We also compare the in-sample and out-of-sample performance of our machine-learning strategies.
This analysis is motivated by Martin and Nagel (2022), who demonstrate that, in the age of Big
Data, when investors face a high-dimensional prediction problem, there should be a substantial wedge
between in-sample and out-of-sample predictability. Our results are consistent with this prediction.
We fnd that, in contrast to the modest out-of-sample predictability, our fundamental signals exhibit
strong in-sample predictability"
...
". We form long-short portfolios
based on machine learning predicted returns, i.e., buying stocks with high predicted returns and
shorting stocks with low predicted returns. We fnd that the equal-weighted long-short portfolio
generates an average return of 0.95% per month (t-statistic=6.63) and an annualized Sharpe ratio
of 1.02 during the out-of-sample period 1987-2019. The performance of the value-weighted longshort portfolio is much weaker, earning an average return of 0.40% per month (t-statistic=2.34) and"
...
"The long-short returns and Sharpe ratios for our machine learning strategies, although statistically
signifcant, are considerably lower than those documented by prior studies. Gu, Kelly, and Xiu (2020),
for example, show that the long-short portfolios formed based on neural network forecasts earn an
average return of 3.27% per month and an annualized Sharpe ratio of 2.45 in equal-weighted portfolios
and an average return of 2.12% per month, and a Sharpe ratio of 1.35 in value-weighted portfolios.
Similarly, Chen, Pelger, and Zhu (2022) and Freyberger, Neuhierl, and Weber (2020) report that the
hedge portfolios constructed based on their models deliver an out-of-sample Sharpe ratio of 2.6 and
2.75, respectively. Thus, compared to the previous literature, our results indicate that the economic
gains to real-time investors from using machine learning forecasts are much more modest.
Institutional investors are more likely to have the resources and sophistication to use machine
learning methods. Previous studies (e.g., Gompers and Metrick (2001)) have shown that institutional
investors prefer large, liquid stocks because they are more investable. To evaluate whether our machine
learning strategies are proftable among large stocks, we repeat our analysis for subsamples of stocks
sorted by frm size. We fnd that the out-of-sample performance of our machine learning strategies
is statistically signifcant among small stocks but only marginally signifcant and, in some cases,
insignifcant among large stocks. The weak evidence of out-of-sample predictability among large stocks
suggests that the economic beneft of using machine learning forecasts may be even more limited for
institutional investors"
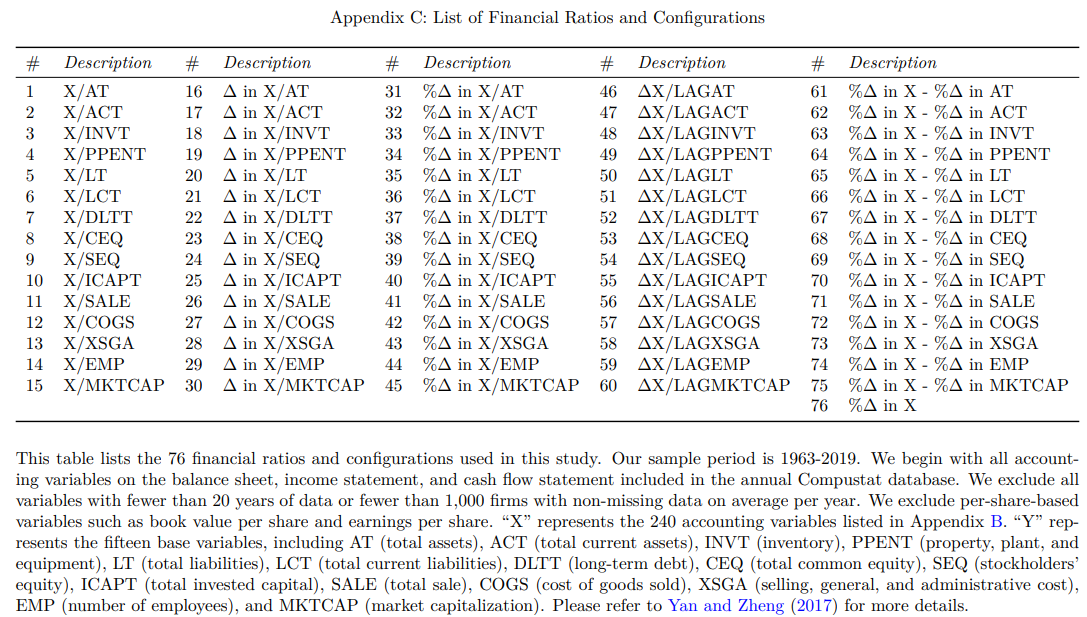
"Because these signals are constructed from financial statement variables using permutational arguments, our strategies are implementable in real-time. Moreover, examining a universe of fundamental signals, rather than selecting a subset of them based on whether they have been published in academic journals allows us to side-step the issue of data mining and look-ahead bias."
This paper uses Boosted Regression Trees, an algorithm that was developed at some point in the early 2000s. Clearly, testing this algorithm on data from the 20th century is not "real-time machine learning." Does it make any sense to exclude "subsequently discovered anomaly variables" and include subsequently developed machine-learning algorithms? Personally, I don't think so.