I’d love to see any data from tests you’ve done that you want to share.
This basic result isn’t really what I’ve found (I used the monthly SP500 earnings data from Robert Shiller’s site, http://www.econ.yale.edu/~shiller/data.htm). Simply looking at US SP500 data from the following recent drawdown periods 1962, 1973 to 1980 (multiple drawdowns), and 1987 to 1989. These are large drawdowns in the SP500 where SP500 earnings were still generally rising throughout most or all of the drawdown period (in these periods most MA based rules would have added something in terms of minimizing DD’s). And ‘common sense’ (which can be wrong) says that any time there is some ‘big news’ that breaks ‘fairly suddenly’ and doesn’t grow out of a very long build up (recession), the market may collapse before companies start showing that large drag on earnings. Earnings related rules will often have a much longer lag then price based rules.
A basket of timing rules (if people want to time at all), is still likely to be the best / most robust bet. I use earnings and think earnings has some real value. But, while I think stand alone rules like SMA5 EPS>SMA 21 EPS can be part of a blend of systems, they have real inherent limitations (as do any single rule). I don’t think there’s any one ‘magic rule’, but think baskets of them work best. I agree that, in general, market timing will often limit absolute returns (if no major DD’s occur, will likely nearly always have lost money using them), but can over many types of market cycles significantly boost risk adjusted returns.
@Jim. Stop watching investment TV for news (apart from entertainment). They simply have to jack up fear or hype to drive ratings. They need extreme views, they need ratings.
I’m surprised this hasn’t been major news in the US but the IMF officially announced that China had become the largest economy - ppp adjusted - ahead of the US of A. Truly the end of an era and a strong symbol.
Meanwhile the US is indebted over $18 trillion worth and counting, the stock market is at an all time high, the margin debt is at an all time high, the monetary base is at an all time high, the velocity of money is at an all time low and QE has just ended. Nothing can go wrong.
aurelaurel - something will go wrong but when? The Fed didn’t have a whole lot of options going forward so low oil prices is the next stimulus they couldn’t generate themselves. This will likely buy us a couple of years. But now the Fed will have the next dilemma on their hands… they can’t raise interest rates significantly to control inflation without bankrupting themselves
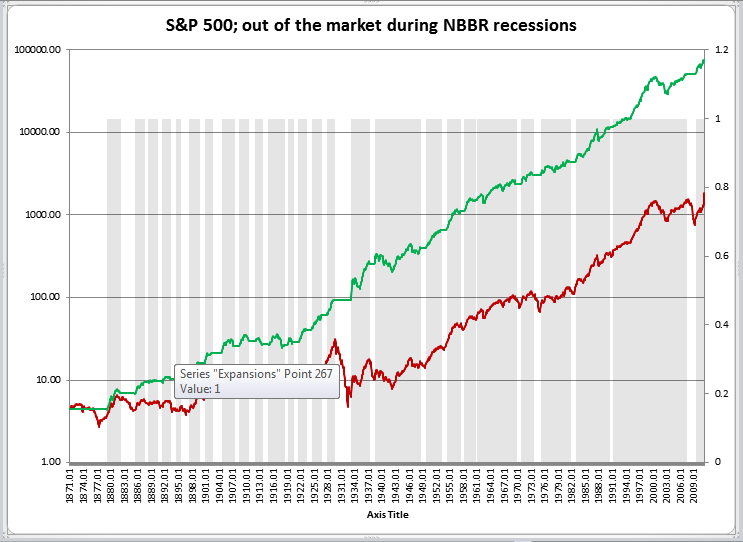
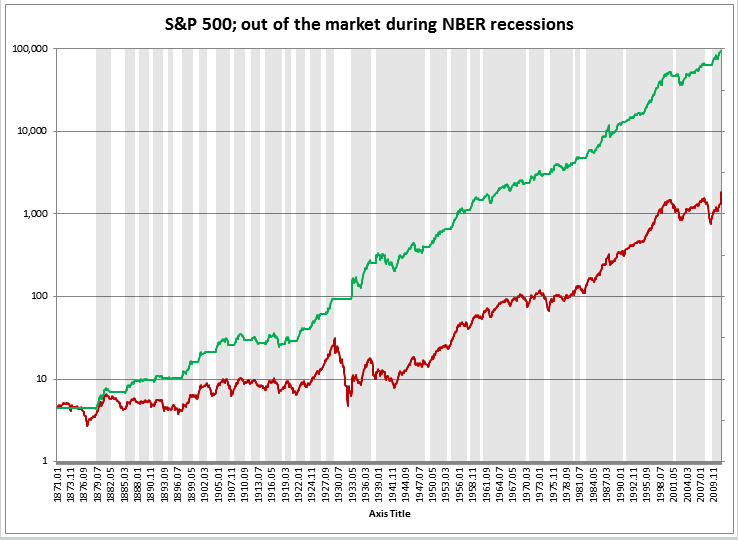
They say that a picture is worth a thousand words. The following chart shows what your returns would have looked like had you timed the market to be out during NBER official recessions. The cash was assumed to have earned 0%:
The performance boost from acting right at the open was considerable for Small Gems, 1.5% /week improvement on average for trades of both types, but all ports outperformed variable slippage over the three-month period for both buys and sells. This study used (Hi + Lo)/2 +or- slippage for comparison, not (Hi + Lo + 2*Close)/4 +or- slippage.
In another study slippage degraded continuously all the way to close, on average:
The retail investor who trades at open and applies the stay-under-5%-of-daily-volume-average rule-of-thumb appears to have an unassailable advantage over large traders in that respect.
I do not know how this encouraging information can be accurately determined and measured for all R2G ports, then presented to subscribers, but this would help all parties if compared to the slippage associated with different trading approaches, i.e, open, mid-day, close. Many (?most) R2G ports are likely better than they appear, OOS.
My understanding is this formula is used for OOS, but (Hi + Lo)/2 is used for back-testing and/or simulation. I can’t remember where I read this. Please somebody set me straight, needless to say this would make a huge difference as (Hi + Lo + 2*Close)/4 +or- slippage appears to be the slippage benchmark most biased towards reporting lower performance, of all the ones discussed here.
too bad you only know that months after it happens. i.e. NBER declared the recession ended in june 2009, but they did not do this until September 2010, similar delays for the start of the recession in December 2007 was not confirmed until late 2008.
There is any way to predict the market top, using market timing rules or when big guys are moving away from market ?
I am looking for swing trading strategies in P123,
Buy stocks when dow/nasdaq is oversold,
Sell stocks when dow/nasdaq is overbought
In, yahoo finance market news commentary,
Most of the time if market comes down, more fear in the market, they will say buying opportunity,
if market is going up they says more greed in the market,
investors are selling short or stay in side ways without participating in the market and
stock price rises without volume and
stock price rises and money is flowing out of market.
There is any way to include the above strategies in P123 systems ?
I would like to stay away from market before market turn down using timing rules and come back when buying opportunities present after market oversold.
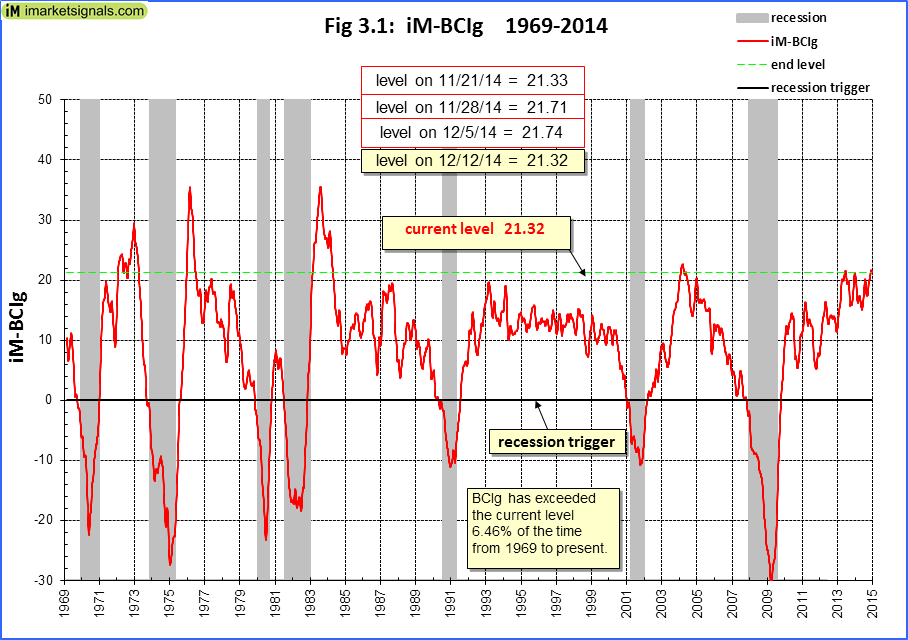
Chipper - It doesn’t appear that the NBBR recession graph has been of much use since 1980. The logarithmic graph shows 1987 and 2000 as wee little blips, where in fact the drawdowns were huge. So one out of the last three crashes/bear markets were picked up, but as was stated, the 2008 recession was not declared until long after the fact.
Q: Typically, how long after the beginning of a recession does the BCDC declare that a recession has started? After the end of the recession?
A: The committee’s determination of the peak date in December 2007 occurred 11 months after that date and the committee’s action in determining the trough date of June 2009 occurred 15 months after that date. Earlier determinations took between 6 and 21 months. There is no fixed timing rule. The committee waits long enough so that the existence of a peak or trough is not in doubt, and until it can assign an accurate peak or trough date.
(In addition to the ones I mentioned above, earnings only data also misses getting you out of all the major DD’s of the 1940’s… so, it’s missed a lot more than it’s called).
You’re using an indicator that is ‘curve fit’ after the fact to determine peaks and troughs and is not point in time. The spreadsheet I sent shows raw monthly PIT earnings for SP500. Just take a look at it. SP broad earnings data typically gets you out and adds something in total, but it very often only works after most / all of the major DD has occurred. It can be used in combo with other indicators to give a more accurate picture, but it still looks like a poor standalone indicator. Curious if anyone else sees Robert Shiller’s data differently or finds interesting stuff in it they want to share?
Of course we cannot use the NBER for market timing. Sorry if I did not make that clear. And thanks guys for clearing that up.
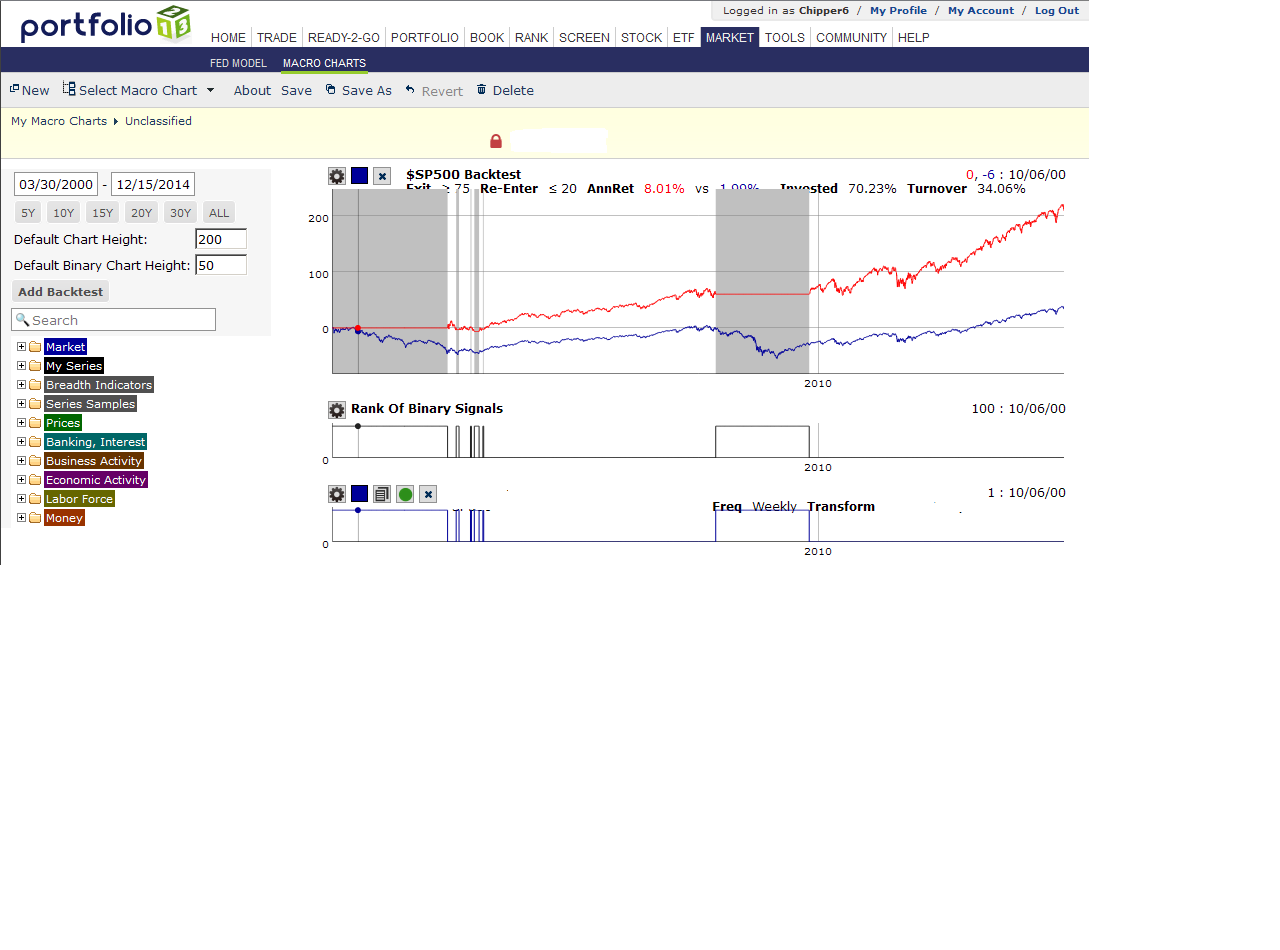
The NBER chart is just proof of concept. Once we know what drives the stock market we can try to build a timing model to detects recessions in real time. I built one that I use for myself and in some of my R2Gs. Here is a backtest of a slightly simplified version of my recession indicator:
EDIT: Clarification - This indicator is not trying to predict the NBER but the market. Therefore there are differences in the dates between it and the NBER.
[quote]
Chipper - It doesn’t appear that the NBER recession graph has been of much use since 1980. The logarithmic graph shows 1987 and 2000 as wee little blips, where in fact the drawdowns were huge. So one out of the last three crashes/bear markets were picked up, but as was stated, the 2008 recession was not declared until long after the fact.
Steve
[/quote]Steve,
There are two important points that you are making and each one needs to be addressed separately. Your first point is of the three most recent crashes it only picked up the financial crisis crash but it missed the 1987 crash and it was only out of the market for a short blip in the dot-com crash. You know what? It won’t get you out every time (what will?) but it did help a lot even for these three most recent crashes!
BTW, the 1987 crash was not caused by a recession. Neither was the 1962 crash. But both of those recovered almost as fast as they went down and during those two crashes MA indicators would have gotten whipsawed too unless you were lucky. No timing system is perfect but even over the past three recessions it did seem to help! That’s why I like economic indicators better than MA indicators. I will grant you that the economic indicators would have missed 1940 while a MA indicator would probably have picked it up. That’s one time out of more than 14 crashes that a MA indicator would have worked better than economic indicators.
Your second point is that the NBER doesn’t announce recessions until long after the fact. That’s correct and therefore we need to use a different indicator that signals recessions faster. Luckily we have some good data and tools now to build economic indicators with, or you can subscribe to a service that is (hopefully) proven to be accurate.
Chipper - I agree that MAs are not the answer. I just have trouble using something that doesn’t seem to be relevant to my trading over the last 30 years. I personally experienced the 1987 crash (unlike the talking heads that seem to think the current oil situation is a crash beyond all others - what a laugh). I remember people at the time indicating that it had no tie to the economy but I can tell you it would have been one heck of a lot better sitting on the sidelines waiting to jump in rather than sitting through a 30% loss. It took over a year to recover, so a lot longer than the crash itself which was 1 1/2 days.
The blip I was referring to was the drawdowns, not the short time a recession was declared in 2001. Which leads me to something else I am having trouble with… what I am hearing about bear markets deriving from recessions. The stock market is a leading indicator. There is something called the wealth effect. When you have a bubble burst and the general population clams up (stops spending) because their investments are in decline, they no longer feel wealthy and they stop spending, resulting in a recession. So in all probability the stock market decline drove us to recession in 2001. The housing market burst probably drove down the stock market and led us into recession in 2009.
I honestly don’t believe it is as straightforward as saying there is no imminent recession thus there can be no bear market.