Hi,
Given that many P123 strategies incorporate momentum, I think this is an interesting and relevant article:
Basically, by using a timing strategy to avoid the market when volatility was high (as measured by VIX > 30), a 39% improvement in annual returns was seen on a long/short momentum strategy. This is very significant and worth exploring how well it might apply to P123 strategies.
I don’t know when I will have time to look into this so thought I’d post in case anyone else wants to … and perhaps share their results?
I have asked about this in the past in feature request section.
A ‘feature’ I would like is the ability to use VIX and numbers on VIX for market timing. Now only really timing we have is SP earnings and benchmark comparisons (i.e. moving averages).
Ability to use VIX based rules (i.e. VIX>(SMA(5,#VIX)) or VIX>30, etc.
Would go a long way on both buy and sell side to helping smooth returns.
Hi,
Yes, I was disappointed to see that the VIX was not included in the indices under the ticker function. There is the VIX ETF, VXX, but only a little more than a year of data. There is also a formula for a synthetic VIX described in an article by Larry Williams, available here:
Been trying to see how i could use it. Would like to apply this to the SPX index or even SPY. When I use spy as a ticker and screen for the above formula > 0 no results but when no list i get the enitre universe.
Looking for a way to use this in a multi strategy portfolio. Not much experience in multi strategy but seem likely it is necessary if you are running real money in challenging times like these where a well thought out strategy may be only valid for a few months.
I just quoted the formula from the article, I hadn’t yet converted it to P123. Sorry for the confusion. In looking at this further, I think the formula (in P123) should be:
I expect this would take the highest SP500 close of the past 22 days, rather than the highest high, and the low of the past 2 days, rather then todays. So this is pretty close, but I am getting errors. I tried the simplest of these by itself, as just a buy rule:
Lowest(GetSeries(“$SP500”),2,0) > 1000
but I still get: Error in Lowest() Invalid series
The formula for Lowest is: Lowest(series , bars , offset)
GetSeries can be substituted for the series and it’s format is: GetSeries(“$NDX”).
So I don’t get why this is not working. Am I missing something or is this a bug?
Read the link, thanks Don. I think the issue with your formula is GetSeries is not a valid series in the Highest function. It only allows open, high,low,close from what I see.
I think this formula works if you use a benchmark of SP500. ((Max(benchclose(1),benchclose(2),etc. - benchlow(0) / Max(benchclose(1),benchclose(2),etc,)) * 100 . I can’t get it to work as a custom formula. Even a simple Max(benchclose(1),benchclose(2)) > 1 works in a sim but not as a custom formula. Strange. While the Max function will take 20 elements, apparently there is a cap on the characters you can enter for one rule. The most days I could get in was 15.
I ran a test sim here so the formula can be easily copied. Watch the brackets, they are important and hard to see in the long formula.
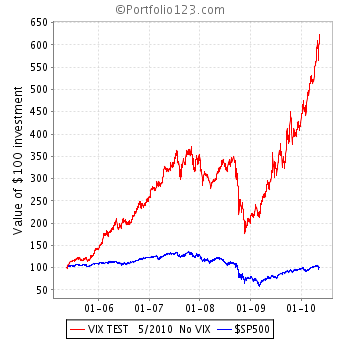
Below is a quick test with no VIX benchmark and a VIX < 5 benchmark. Pretty interesting. Looks promising to me.
Hi,
From the full description of the Highest function:
Same info is in the full description of Lowest. So as I read the help it should work. GetSeries() can be used in place of a series value such as #Close or #High.
Glenn, any reason why you chose VIX 15? Did you run out of room?
I ran a couple tests in a couple sims. Although I can’t say this rule is better than others, for a first test, results are surprisingly good. Comparable to other timing rules I have, including the one Isaac posted - which I use in combination with benchmark moving average timing.
Also of note, is that the $VIX is currently above 30. The level suggested in the article.
I just picked 5 from a glance at the chart in the article so there is lots of room for improvement.
Don:
Yes, I ran out of room. Tried 20 days and it didn’t work. You might get another day but I did not try it.
I think the 20 or 22 days may be important. I downloaded the SP500 history from Yahoo and ran the VIX formula with 5, 10, 15, and 22 days since 1/2007 just to see how the signals compared. It was interesting that they all seemed to give a signal over 5 on the same day. Maybe the drop in the low is the real indicator? The 22 day VIX was more consistent in signaling to avoid the market than the shorter term versions. For example, there was a consistent exit signal VIX>5 on 9/4/2008 for all 4 calculations. The only one that stayed out was VIX 22 until it dropped below 5 on 12/8/2008. The others had more re-entry signals during this time. The shorter the time period the more interim (maybe false?) signals.
I get a more consistent reading and lower drawdown using the Benchlow(0) rather than Lowest(GetSeries(“$SP500”),2,0), which would be the lowest close over 2 days. Also, you really need some trading costs in a sim test to provide a cost for the exit and re-entry; IMO.
It does look like we have a working VIX clone indicator to use in testing thanks to Don and Marco.
Hi,
Glenn, I agree with your update to the formula, thanks. The only advantage for using Lowest would be if you want to use a benchmark different than the SP500.
This seems to be an effective timing formula, at least over the past 5 years. Pretty close to others that I use, though still not my favorite. In the few tests I ran I do seem to get the lowest drawdowns with this rule, but not the best risk adjusted returns.
If anyone is interested, attached is a quick, simple spreadsheet that shows the daily signals for the VIX SP500 clone since 1/2007. I think the data and signals point out some things that are important to the discussion Marco started here , as well.
The VIX < 5 signal consistency was surprising to me. If a formula gives many signals what do you do? Look at Benchclose(0)/Benchclose(5) > .98 in the last two weeks. A signal to exit on Monday 5/10 and a signal to enter on 5/14 - not good. Smooth it with sma(5) and it is worse. No signal.
Hi,
I’m not sure what to make of it, but it is interesting to compare the timing strategies. I thought that the VIX might have a tendency to be earlier than some others, but doesn’t seem to be the case. I was curious how the real VIX compares to the synthetic VIX, so I downloaded the data and added to your spreadsheet. The Synthetic VIX might actually be better than the real VIX. While I was at it I calculated the benchmark moving averages and the timing strategy where close > ema(20, 50, 200).
It’s still hard to tell. I thought of adding the returns of timing the SP500, but that is not really what we are looking for. We are looking to trade or not trade quantified stategies expected to outperform the SP500 based on timing. The best timing for the SP500 is very likely not the best for timing sims. The best way to tell is to have the capability in P123 and test the different variations. But per Marco’s point too much testing just leads to data mining. This is one of the reasons I’m using the basic moving average strategy. It’s based on the most important data - price, so it’s guaranteed not to miss a major bear market.
Hot Penny Stocks that are attractive to accomplish a huge move. We alone aces the best penny stocks for our associates through chargeless top penny stock picks and in our penny stock newsletter. Let us visit this investment site: www.coolpennystocks.com
I will only consider your service if you first tell me what factors you use to select penny stocks. I will not even visit your site until you provide this information. I have visited too many worthless sites in the past so I want to use Portfolio123 to INDEPENDENTLY verify that the factors you use really work.
If you are not willing to share the factors then your post looks like self-promotion which I consider inappropriate in this form.