Hi Sabarish,
There are many naysayers about technical analysis (TA), but I find it is usually because those people simply don’t have enough experience with it. It does take time and effort to learn TA, and most individuals with training in fundamental analysis are not interested in learning a whole new discipline. I know, because I was there myself. In my opinion, you are on the right track in seeking to learn technical analysis (TA) and find a site that can provide it as a supplement to P123.
In 2004, I launched my site, IntelligentValue.com, devoted to value investing using quantitative analysis enabled by P123. I had spent the prior 20 years of my career valuing equities and private companies based on fundamental analysis. I was able to get what I (and many others) thought were excellent returns from P123; as much as 50% per year. I had no interest in learning technical analysis, and like many value investors, considered it akin to astrology.
However, when I saw that a couple of run-of-the-mill downturns made large groups of my subscribers bail out at the worst time, I spoke about it to some of my associates whose opinions I value highly. When I was counseled to learn technical analysis, that it works, I decided to take it seriously and I committed myself to learning the discipline. I wanted to see if I could prevent some of those drawdowns that were frightening my subscribers out of the stock market.
Back in 2004, Denny Halwes recommended that I try StockCharts. Right off the bat I was able to avoid the worst drawdowns using some basic TA signals. Then I was fortunate to strike up a relationship with John Gray, who heads up InvestorsIntelligence.com. I learned a wealth of information from him in a short time. As I discovered and applied more TA techniques, I was able to hone my approach. I have been able to triple the average annual returns of the IntelligentValue.com model portfolios (110% and 185% AR) over what I was doing before using technical analysis.
HOW TECHNICAL ANALYSIS HELPED ME
I consider technical analysis to be an adjunct to fundamental analysis. In other words, fundamental analysis (with P123) drives my stock returns while TA enhances them.
Technical analysis, when applied correctly, can help you identify the optimum entry and exit points for stocks you have uncovered with fundamental analysis. I have also been able to identify and use significant changes in market direction, i.e., ‘market timing’ to enhance returns I use TA to identify market risk, which I use to identify times to place stops or move to cash, helping to avoiding return-destroying downturns, while also identifying when the market is going to turn higher after a selloff, thereby turbo-charging returns of the undervalued stocks in my portfolios.
Back in late 2007, I purchased inverse ETF positions when everyone else was floundering, not sure what to do. Being able to see when the market is going to sell-off and get into short positions before the inevitable big drop is a very profitable experience. In the long 2008/2009 crash, when the market was losing 50%, TA enabled me to make a sizable profit, beating the market by a handy 129%. (Anyone who says that “you cannot time the market" really means that they cannot time the market.)
Technical analysis also signaled precisely when I should go ‘all in’ with portfolios full of undervalued stocks on March 9, 2009. It also told me to stay in the market even when it would have been easy to be scared out of stocks at every whisper of trouble following the catastrophe that had preceded. By staying fully invested when many were calling for another Great Depression every week, my results were phenomenal. If I had been investing as I had before, trying to establish levels of exposure based on my interpretation of all the chaotic information at that time, I would have made little or no return that year. Instead, I ignored all the noise and by using technical analysis and buying when others were fearful, my returns were at 1000% for both my portfolios through the end of 2009. I have never had a losing year and beat the market by big margins every year, thanks mainly to the application of technical analysis methodology.
RECOMMENDATIONS
FinViz is great for giving you a quick look at the chart and fundamentals of a company, and that’s the first site I look at when I have a new stock recommended in a P123 rebalance. However, I’ve had the paid FinViz subscription, and it does not hold a candle to the technical analysis that’s available at StockCharts.com. A basic subscription to StockCharts is $14.95, while a subscription (for a whole lot less site) is $39.95 at FinViz. If you go to the StockCharts home page, you can click the links at the top of the page to see the Free Charts section, the Chart School section, etc. There are also links down the right side of the page. Videos are at [url=http://stockcharts.com/videos/]http://stockcharts.com/videos/[/url] . There’s enough free content to give you a good sampling and keep you busy for a few days. StockCharts also has a free 10-day trial. (By the way, I have no vested interest in StockCharts.)
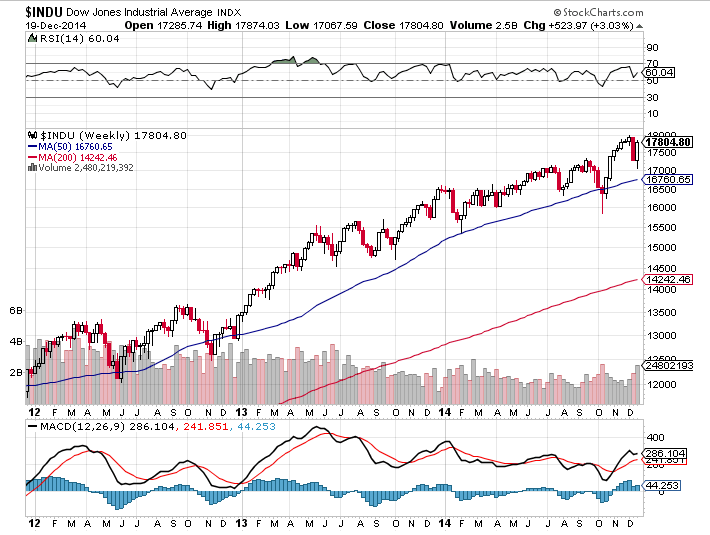
In response to one of your specific questions, as a StockCharts member, you can see 10 charts per page of stocks/indices in your predefined chartists. That’s how I review the technical aspects of my portfolio stocks each week. I have the technical indicators that I use already laid out in the charts along with my annotations of each chart. It’s easy to get a quick scan to see if any positions show an oscillator at an inflection point, have sagging momentum, have reached a caution or stop level, etc. There are many basic TA criteria you can apply in your P123 systems, but IMHO, technical analysis is primarily a visual tool.
THE TWO WORKING TOGETHER
As great as P123 is, the technical analysis component is rudimentary. Don’t get me wrong; I don’t think P123 needs to change anything, and as a business model I certainly don’t think Marco needs to become focussed on technical analysis at P123. It would be impossible to integrate the capabilities of a mature, fully developed technical site like StockCharts into P123, and the level of complexity at P123 would increase exponentially.
However, the two can complement each other. For example, as a member, you can run a screen in StockCharts of companies that meet your favorite technical combinations; perhaps a price rise above its 100-day moving average with a CCI that has broken above the 0 level. Take this list over to P123 and check to see how each company ranks based on your best valuation system and you have the makings of a new portfolio or watch list. Alternatively, go vice-versa, P123 fundamental selections fed into StockCharts technical rankings.
In fact, for members, StockCharts has a proprietary technical ranking system that they call (obviously) the Stock Charts Technical Rank or SCTR. It is a numerical rating of cumulative technical aspects of a stock or index. I have not tried this, but that one technical component might be a simple way to get a quick and dirty technical rating on your best fundamental stock picks from P123. The options are unlimited on how you can combine these two outstanding services. The mind nearly boggles at the possibilities…
Hit me up if you have specific questions. Good luck!