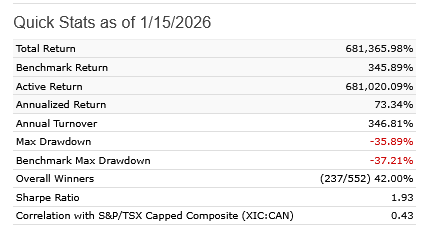
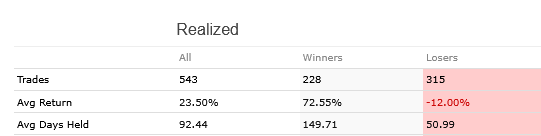
I have spent the better part of the year refining my model and have reached the point where, given my knowledge (and my zero knowledge of how AI works) can’t add or delete anything to make the model better, and still investable. Over 11 year periods of backtesting, the one thing I noticed is the model has never been able to get past a 50% win ratio. I have actually examined every ranking factor and buy/sell rule one by one to try to find out what the losers are hitting on…. but I can’t find any commonality. The only thing I have found is there is a handful of stocks that are perennial losers, but I feel that would be cherry picking if I were to exclude them.
1 Like
Thanks for sharing. Did you really find no commonalities among such a high count of instances? How are you going about finding the commonalities? If you start with that handful of stocks what traits do they have?
Perhaps I could have worded my initial post better. Yes I can see the individual factors, but any attempt to remove or modify them causes the total returns to decline as it removes several big winners.
The simplest test for you to make sure you have not made an overfitted strategy to catch a few historical winners. I would pick out the top 20-30 best trades, remove them from your universe and test the strategy again. If the strategy falls apart, it’s not a robust system
1 Like
Thanks, good idea. I removed the top 20 trades by putting those stocks on the restricted list and reran the sim. Overall gains drop by 20%.

1 Like
I can’t speak to the robustness of your system — and ensuring robustness rather than overfitting is critical. But, as a trader, I would say that increasing win rate doesn’t necessarily make a model “better” and shouldn’t necessarily be the goal.
2 Likes
What is the rebalancing frequency or average holding period?
Interesting thanks for sharing. I was thinking it was shorter term than it is given the win/loss. If I was you I would try to do a deep dive on a handful of the worst losses and try to come up with common sense factors you might not have thought about before. You might have to think out of the box on this one. I do think it should be possible to improve given the holding period
From what I can see the sell rule:
GainPct <= -10
triggers most of the big losers because they had significant one day drops.
Hmm this explains a lot. Basically you are getting around the high number of losses by having a de facto stop of sorts. The stop is not allowing for the worst losses to occur. The losses that remain are closer to “average picks”. Try removing the stop (not permanently) then analyzing the worst losses for useful insights
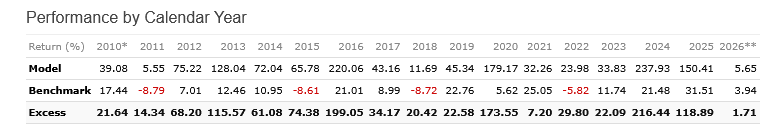
So far the model has yet to have a negative yearly return, though I only have access to 11 years of data. I have also used different time periods and start dates to confirm the postive returns.
my biggest loser was -77%, because it imploded during one day.
Yes so basically once you rerun you should see a higher number of large losses to analyze for commonalities if you were so inclined. Many of your worst ones today are probably catastrophic events with less predictability
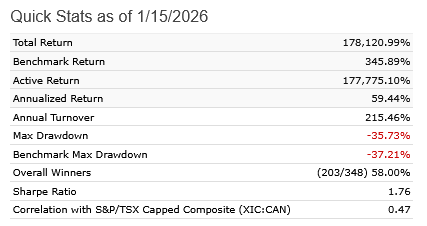
If I remove the sell rule, GainPct <= -10, the win/loss rate improves, but overall returns drop, including one negative year in 2018.
If you go to transactions do you see a lot more large loss transactions?
Yes, in the 30%-80% range.
1 Like
Yes so the purpose of this exercise is not necessarily get a better return off the bat but rather give you more large losses picked by the system (ex-stop) for you to analyze for traits to avoid and experiment with. Hope you find some useful insights
Thank you for the advice.
1 Like
Of course, keep us in the loop! Looking forward to hearing back on any improvements