hi Marco,
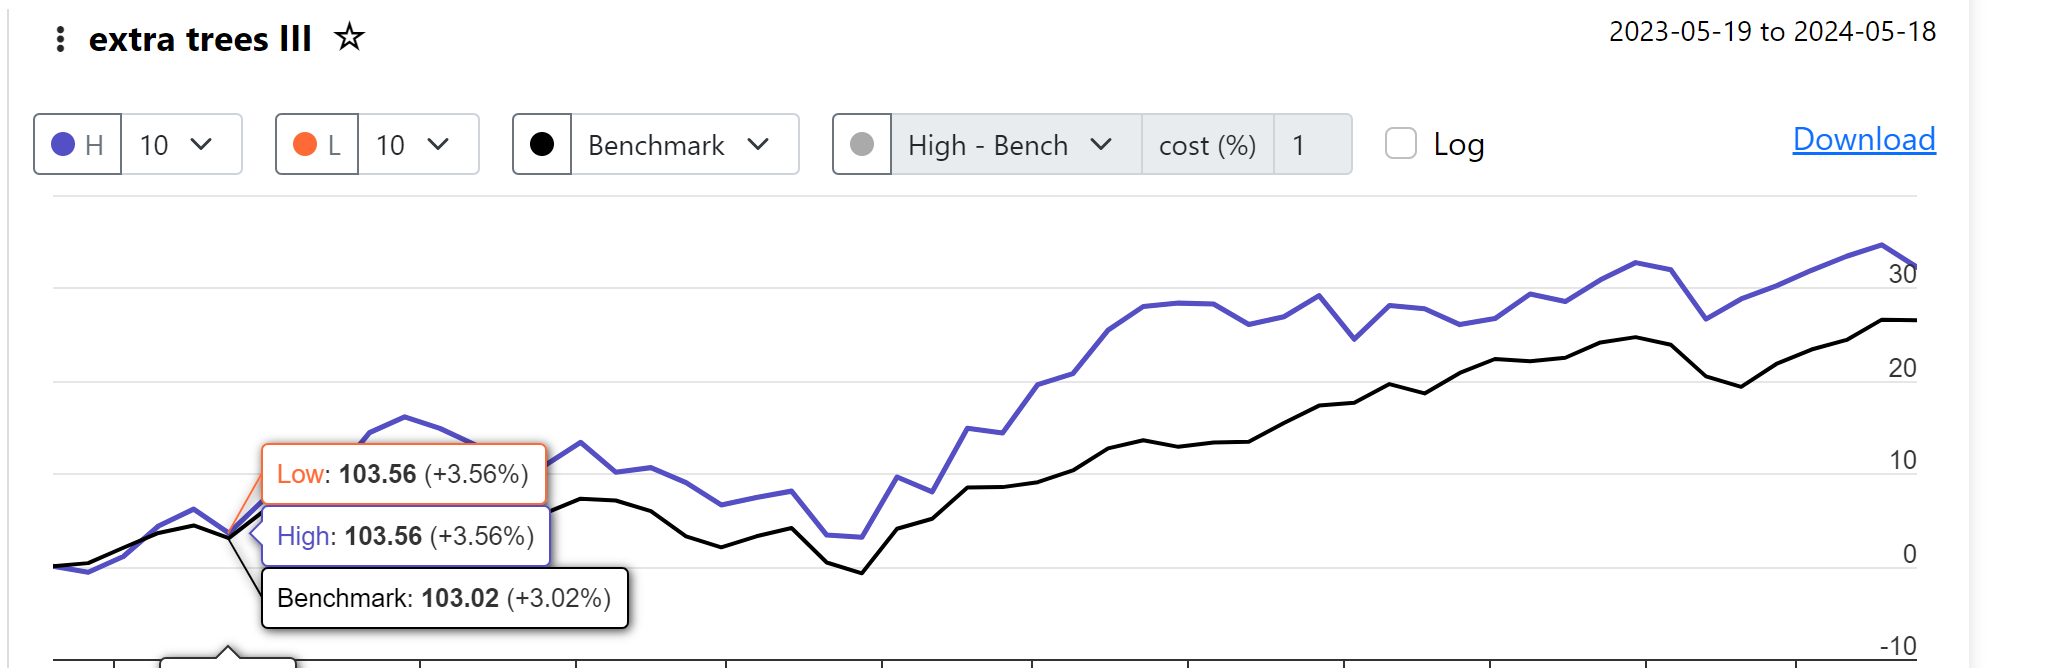
In the above picture, If i choose H10 and L10, I can see the their data points totally overlapped. Is this something wrong or here H10 or L10 have some different definition?
Thanks
Taofen
hi Marco,
In the above picture, If i choose H10 and L10, I can see the their data points totally overlapped. Is this something wrong or here H10 or L10 have some different definition?
Thanks
Taofen
H and L are two series and can be set indiscriminately to any quantile. Setting them both to the same quantile will plot the same series twice.