3 Sectors Survived the Selloff and My Watchlist Helped Spot Them

The market's been hit hard lately—Trump's tariff talk has sparked a wave of selling across equities. But not everything went down. A few themes quietly outperformed, and thanks to Watchlists in Portfolio123, I was able to spot them instantly.

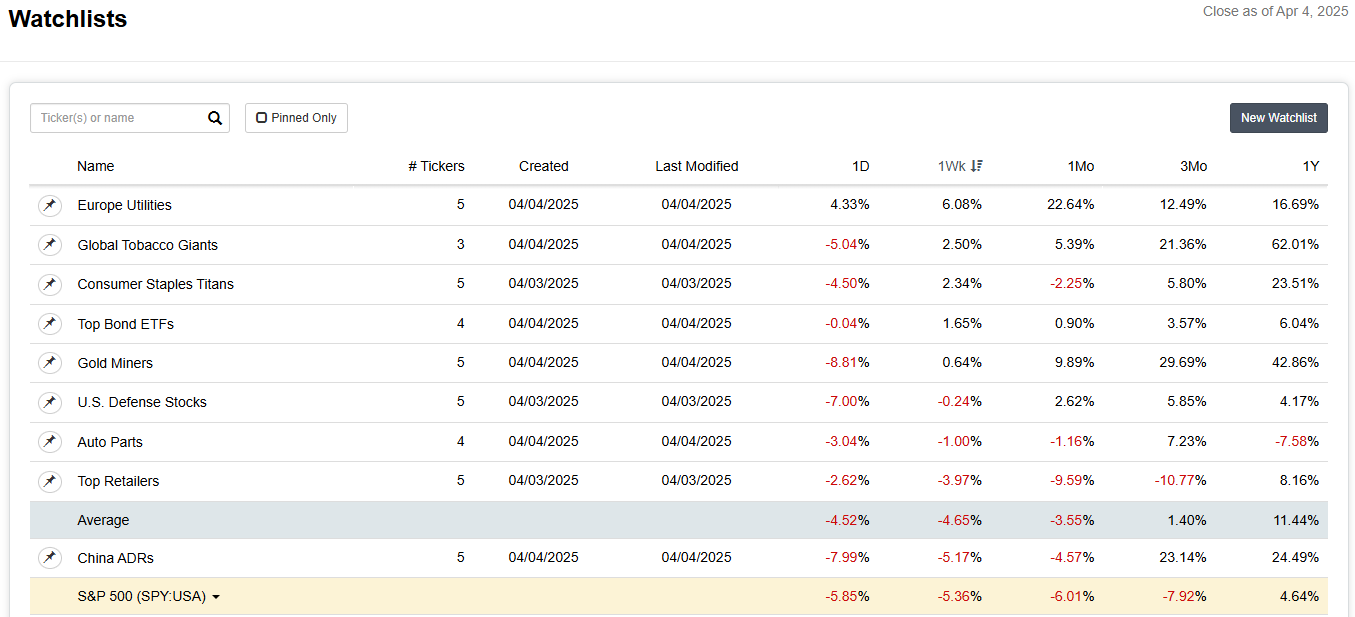
If you haven’t used this feature yet, Portfolio123’s watchlists aren’t just static lists of tickers—they’re grouped watchlists that show you the aggregate performance of a set of stocks. You can build themed groups like “Gold Miners,” “Tobacco Giants,” or “Auto Parts,” and the platform calculates returns across 1D, 1W, 1Mo, etc. This makes it a powerful radar for thematic trend spotting.

This Week’s Surprise Winners

I sorted my grouped watchlists by 1-week return to see who’s swimming while everyone else sinks. The S&P 500 dropped -5.36%, but three themes stood out:

1. Europe Utilities: +6.08%

These are a defensive powerhouse in disguise:

  • Stable income streams make them attractive in volatile markets.
  • Minimal U.S. exposure means tariffs don’t touch them. Their revenues are domestically driven—regulated, predictable, and insulated.

2. Global Tobacco Giants: +2.50%

Another classic defensive group:

  • Strong pricing power
  • High dividends
  • Recession-resistant consumer behavior

3. Gold Miners: +0.64% (but +30% over 3 months!)

They shine when fear rises. This sector has been steadily climbing as investors hedge against uncertainty and inflation.

Watchlists = Trend Spotting at Scale

Grouped watchlists are more than just organization. They let you:

  • Detect sector rotation early
  • Compare macro themes side-by-side
  • Track quant factors (e.g. High ROE, Low P/B)
  • Build a factor dashboard that actually shows live performance

Conclusion

Even during a sell-off, smart tools can give you the edge. Grouped watchlists let you track how entire themes are performing in real time, showing you where strength is hiding and helping you stay diversified when everything else is red.

I found that European utilities, global tobacco, and gold miners held up best this week—each offering stability, defensiveness, or insulation from U.S. tariffs.

What other themes are you seeing that worked this week? Any surprising areas of strength that helped diversify your portfolio? Curious to hear what others are tracking.

4 Likes

I'll bite.

One asset class that I happened to hold some exposure to were unhedged international bonds (ETFs: BWX and IGOV). Both yielded a positive return during the market turmoil.

Having said that, I think it was really hard to benefit from the drop last few days - other than hedging with for example put options as a general portfolio insurance. That would have only worked if you held these options before the event.

When it comes to Watchlists, I think it is an interesting tool to learn what's happening - or what has been happening - in the markets. More specifically, like you mention, it can be interesting to see what assets (and asset classes) have been trending lately, which can be helpful if you want to construct a robust multi asset strategy that incorporates trend and want to come up with ideas.

It can also be interesting to see what factors and sectors/industries are outperforming and compare that to your own systems.

But the real question for me would be: how do we then indeed incorporate any lessons that we take from the watchlists into a strategy? How do we actually systematize this?

We most likely don't want to completely overhaul a strategy based on one event. We also don't want to be manually adjusting factor weights or exposures based on anecdotal evidence, on something we happen to read or see that day.

To incorporate the information we see in real time in the watchlists we have to be able to convert our observations into signals, and to test them. Which is something that can be done in P123. Let me share some ways to do that.

For sector rotations, one way to do it, would be to test sector or industry momentum as a factor. Sector and/or industry sentiment (earnings revisions, short interest) could be interesting too. I have tried both and find them good additions to a ranking system. Companies that are part of trending industries and/or sectors, seem to continue to perform well on average.

When it comes to certain factors outperforming, I've read some people claim success betting on factor pesistence (Looking for Advice on Optimizing Factor-Based Ranking in Portfolio123 - #25 by sthorson), but when I tried myself (I really wish factor momentum would work - help me show that it actually does), results were mixed. I have also not seen anyone share a practical way of testing this (other than my own) that shows positive evidence.

Macro regimes can be tricky, but some interesting work has been done on the high yield spread, which is available in Portfolio123 - and can be tested as a macro factor for stocks as well as an indicator in a multi asset strategy.

For example, when high yield spreads are low and rising - like they are now - typically risk off assets outperform (like utilities that you mentioned, and bonds that I mentioned). Of course, when markets move so fast, it is not easy to capitalize on that information. What is more useful and interesting, is that when high yield spreads are high and dropping (which I expect to happen in the next days or weeks) - pretty much by any measure of 'high' and 'dropping', certain assets (that most benefit from increasing credit flowing into the system) are very likely to outperform: small and microcap stocks, preferably the cheap, illiquid and levered ones, usually Industrials, Cyclicas and Financial companies. In terms of asset classes, hard commodities spike (e.g. ETF: DBC). See for example: Macro Factors

Another indicator - available in P123 - is the US dollar index (ETF: UUP). When the dollar drops relative to other currencies like it did last few days (though it has been volatile), emerging market and European companies that hold dollar denominated debt, all of a sudden have a much easier time to pay off their loans. It is one reason why emerging market stocks have not sold off much more than US stocks - which usually does happen in these crisis situations.

As both of these variables (high yield spreads and the dollar index) are available in P123, we can incorporate that information in our strategies.

If I would have to make a bet right now - and I have tried to incorporate this in my systems - is that when the high yield spread indeed starts to drop of a peak, it would be to go hard into microcap stocks (and out of capital I hold in my multi-asset strategy). The more the dollar keeps dropping in value, the more weight I give to european microcaps and the opposite for US based microcaps.

1 Like

Just do nothing

Factor momentum is the most valuable predictor of factor returns. However, it is still unable to achieve any large enough (to overcome its extreme operational complexity) improvement after overcoming transaction costs.

As for your belief in predicting the movement of broad asset classes based on spreads or other information, if this does work, its should already be reflected in a systematic futures strategy - which sadly isn't very profitable, and doesn't work as an insurance policy this time around, but rather exacerbates the decline.

1 Like