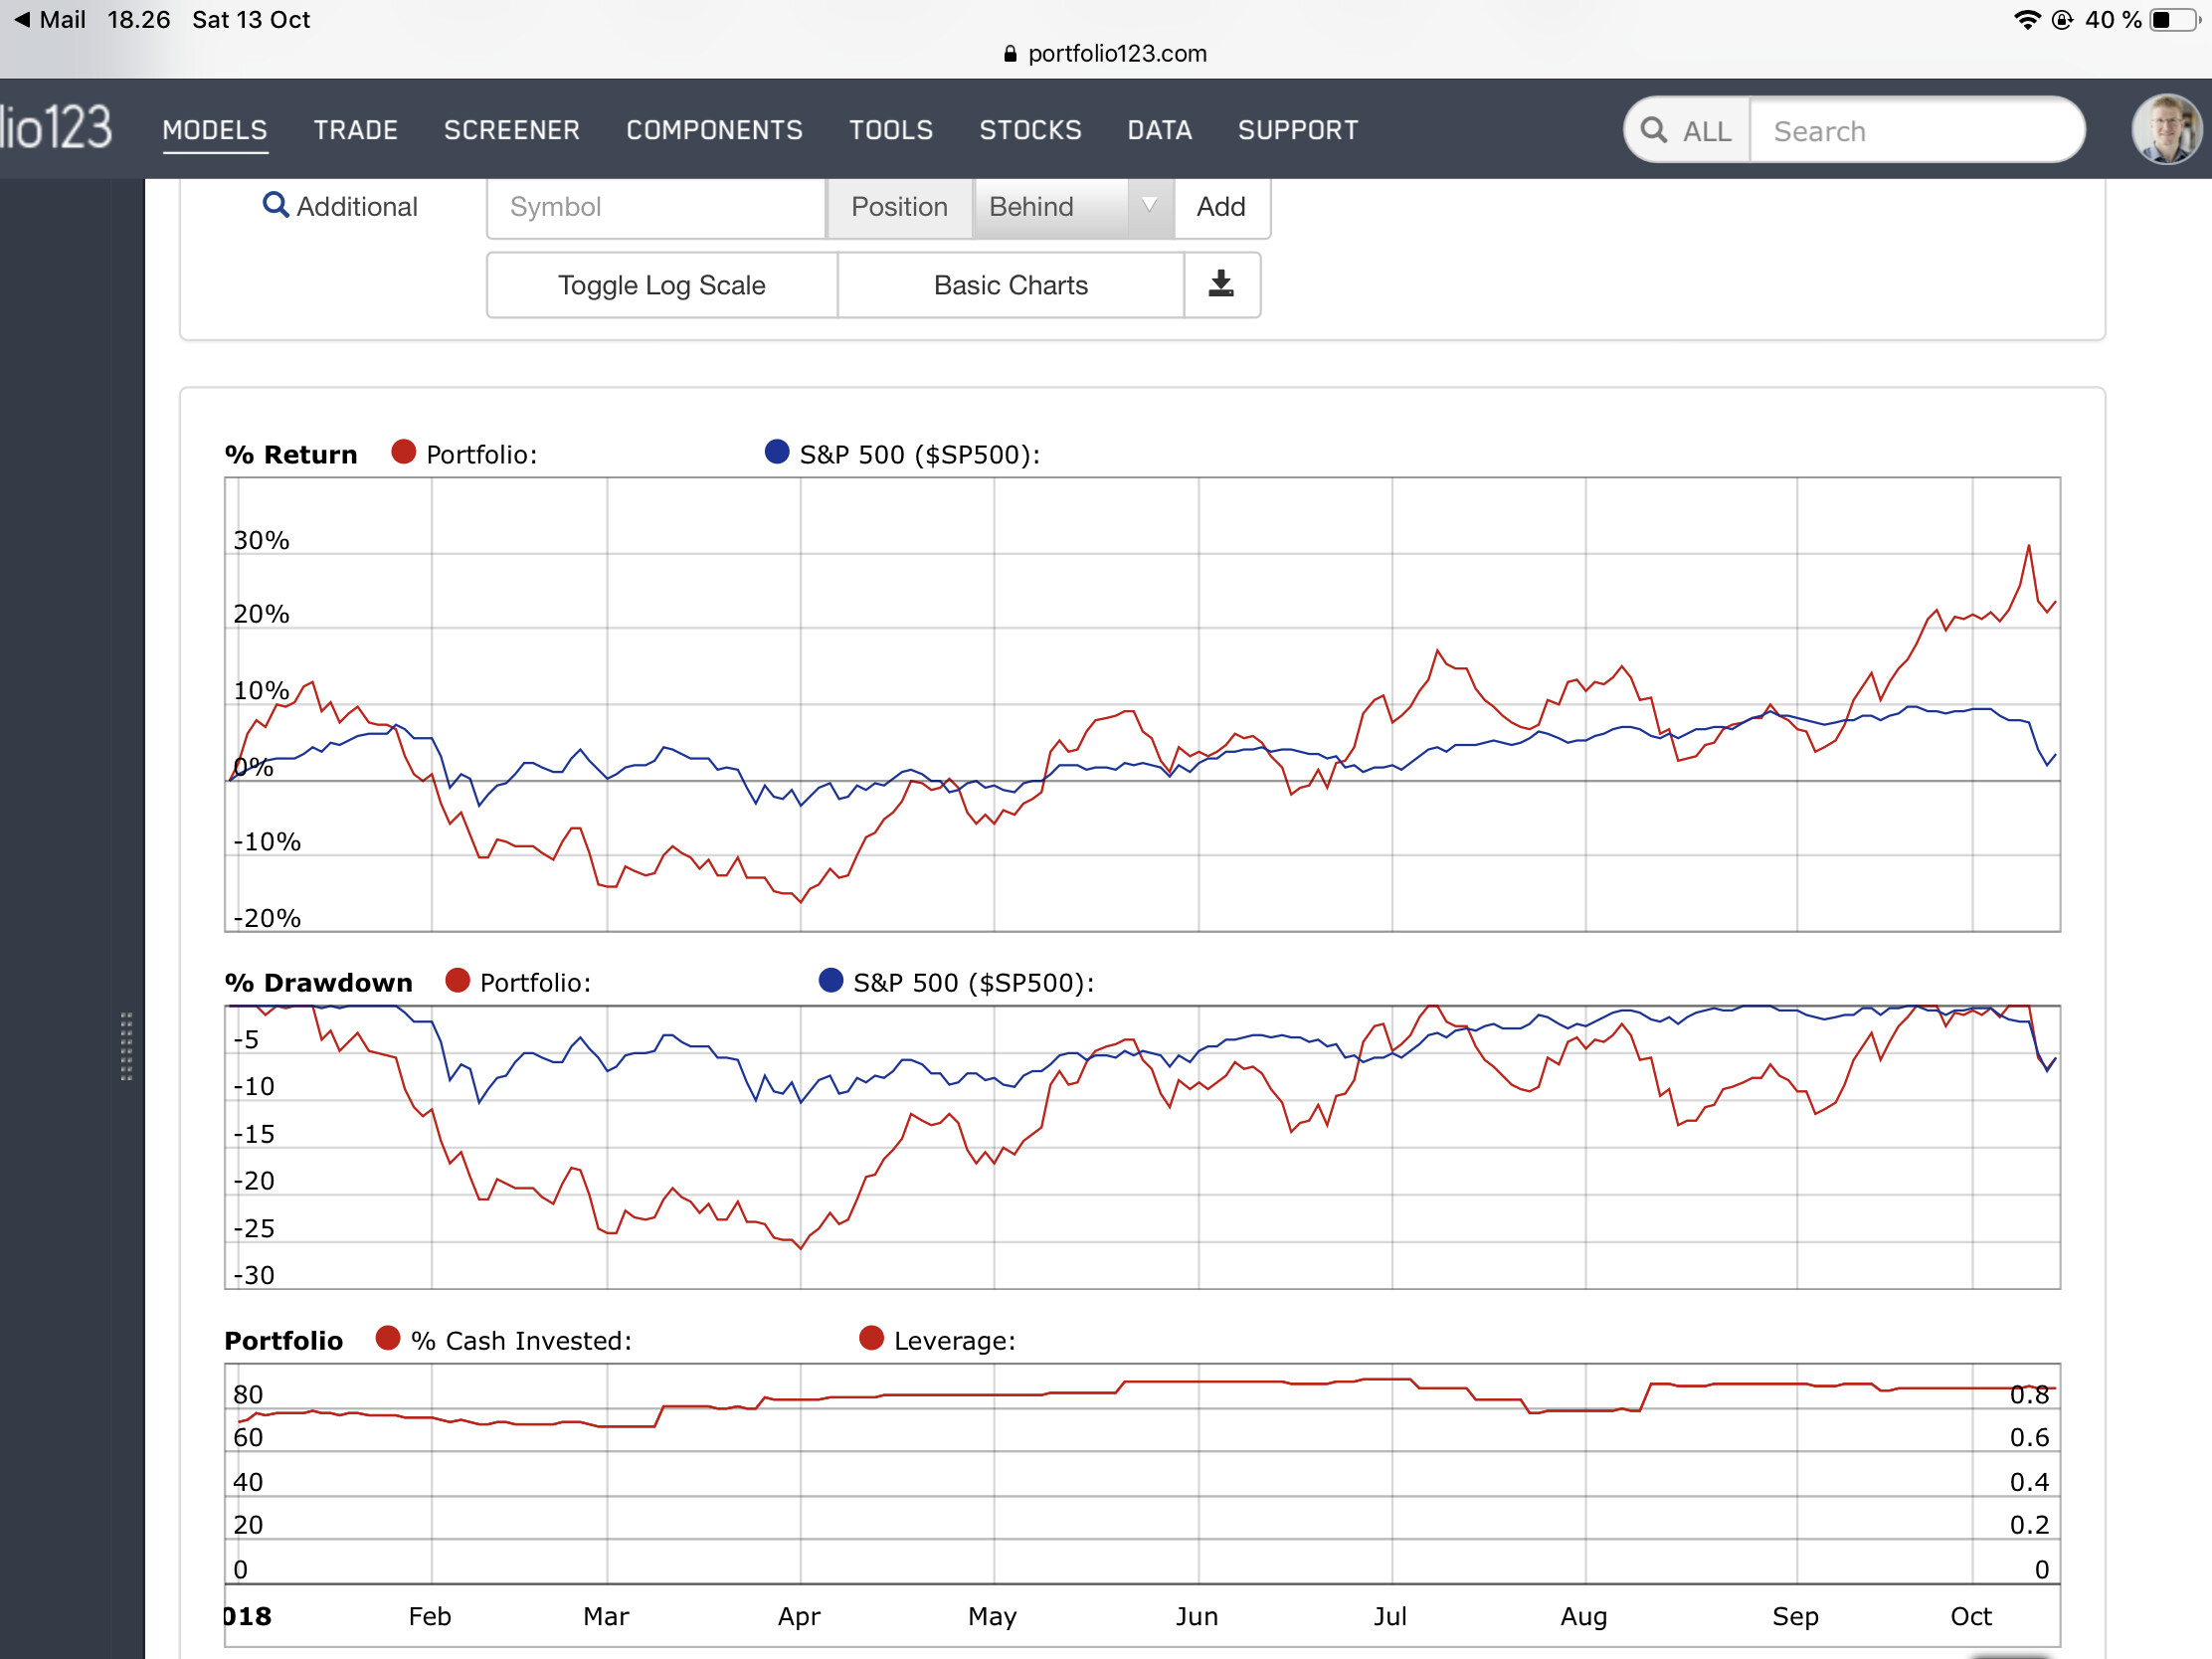
Yesterday my drawdown was 9.4%. As of end-of-day today, YTD: -0.7%.
I have no idea if this correction will become a bear or not. My strategy remains the same either way: just do the same thing I’ve always done. No cash. I’m only going to switch tactics (slightly) if I think a recession is coming, and I don’t see signals of that yet. But a bear market can cause a recession. It’s happened before.
Thank you all, will Keep this thread alive from time to time depending on how things develop…
Yesterday there was some buying at the 200 MA of the sp500, lets see…
The drawdown across my portfolio was -10.7% without a hedge. I got away with -8.2% due to SPX puts on futures put in place at Monday’s close. Thanks everyone for sharing.
The macro picture does not look good. The historic trend forecasts a probable loss of about 15% for S&P-real to Jan-2020. (As of writing Feb. 9 the market has already given up about 6% from January’s average value.) The worst scenario would be a possible loss of about 55%, and the best outcome would be a 65% gain from the January level. Probable real return to Jan-2020 = -10%
I am sure the market turns on me next week/month, my max drawdown this year was only ~2% in €. YTD up 7%, but i am 105% long, 80% short and currency hedged into undervalued currencies so not really a fair comparison. And my last two years really sucked, so don`t ask.
There was a seven-year span from 1991-1998 that for me was a lot like today. Everything was clicking for businesses, the economy was robust, and the market was kicking butt - with low volatility. It was easy just to sit back and make money hand over fist. Pick and ride a winner (they were everywhere), sell it as it got expensive, then get on the next pony and repeat.
It’s hard to compare anything to the 1982-2000 bull market, with a 1200% performance in the S&P that has never occurred before in history and perhaps never will again. We can hope this “easy money” experiment that’s been going on for the last nine years is not going to end as it did in 2000 and 2007, but I would say it’s probably likely.
I got a 5% DD, how are you doing? Up 10% for the year (with FX Exchange wins, without around 5%). Still long here 100%, since capital curve did not prduce a lower high…
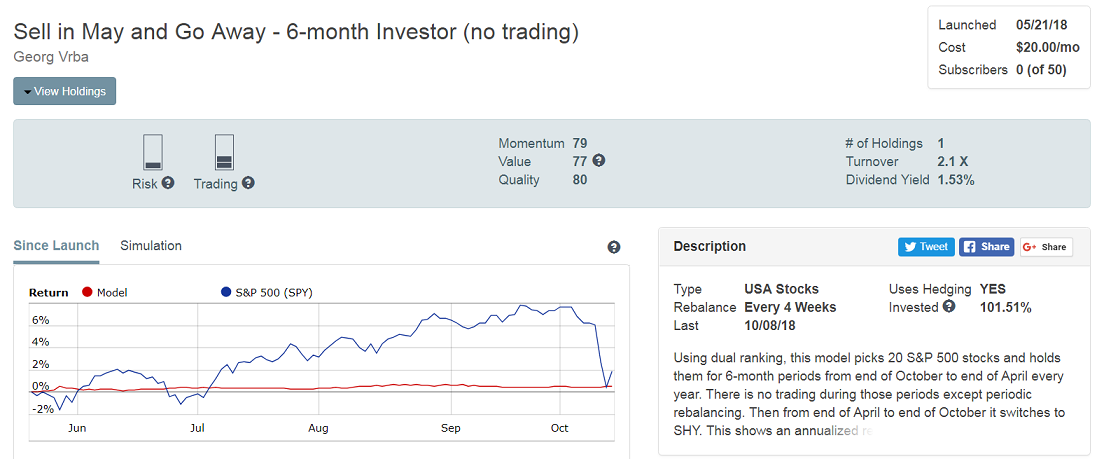
On average, all the returns of the S&P 500 are made during the seasonally six strong months, November to April.
The market shows zero return on average over the seasonally poor months, from May to October.
For election years (even years) the absolute return of the S&P 500 for the 6-month period prior to election (May-Oct):
34 samples excluding best and worst return periods, average return= 0.46%
My P123 ports are up about 8.5% ytd after peak DDs of about -8.5%. Still 100% long. Interesting to see the ytd of RSP is 0.9% while SPY is up 4.8% and QQQ is up 12.5%. Sort of an obvious tilt in favor of large caps for now, but will it continue? I feel a need to compare the expanded list of P123 benchmark series against each other for actionable info…
But I personally haven’t forgotten the 2007/08 financial crisis. Particularly, I remember how its solution wasn’t to address the major problems that result in asset bubbles, but rather to inflate them away at the expense of ordinary taxpayers. I reckon that one day there will be payback for the loosey-goosey fiscal and monetary policies which fueled the last ten years worth of asset price appreciation. I think it’s easy to forget that low interest rates portend low future economic growth and that quantitative easing is basically borrowing from future growth.
And in the next credit crunch (due any time now), what is the federal government’s big move? Defer to the federal reserve. What is the fed’s big move? Lower interest rates by 3%. But, wait a second… How can you lower interest rates by 3% if they’re already less than that?
There are no free lunches.
Again, this recent selloff probably isn’t that event.
My max drawdown was -9%, back up to -8.13% as of last close. YTD up 22%. Microcaps have been hit especially hard: IWC is down 11.7% since end of August.
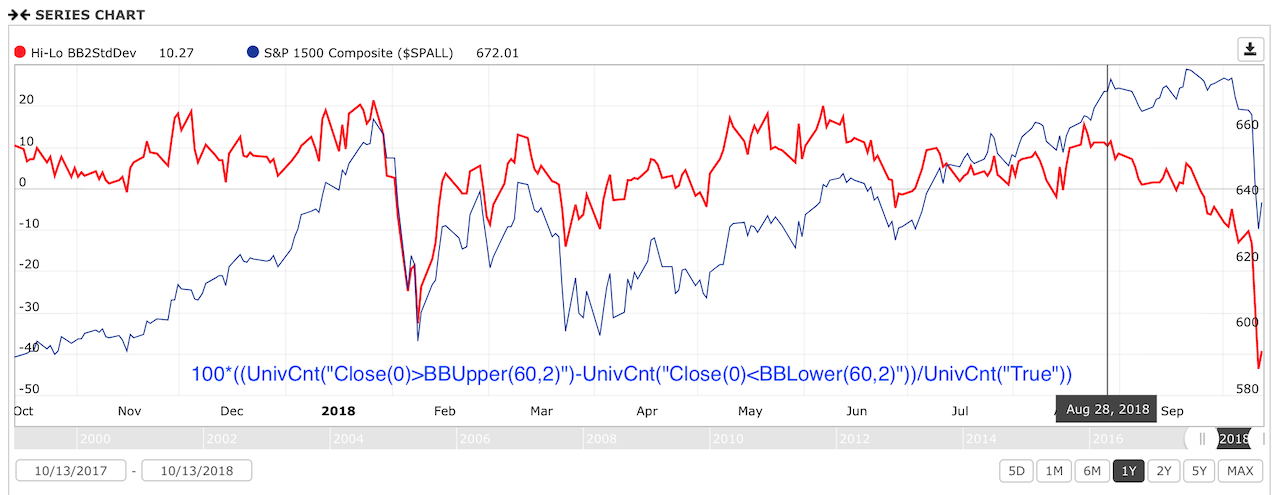
The selling started in earnest when Powell signaled that he was probably going to go past neutral (3.0%).
One reason why is that there is record corporate debt on the books, and at interest rates exceeding 3% the increased debt service consumes all free cash flow growth.
For the first time in years, the 10-year yields more than the average S&P dividend. Rising bond yields serve to reduce the appetite for equity risk. Not to mention negatively affect company valuations based on discounted cash flow.
To compound matters, large/mid cap median Q1 sales surprises peaked at over 1.5% and have begun to decelerate. Peak median sales surprise percentages above 1.5% often lead to deceleration and market sell offs as expectations for future surprises are grim at that lofty level.
Fun fact - three of the last 5 Fed Reserve chairs brought stock market crashes/extreme bear markets with them into office.
The aggressive posturing with regards to interest rates implies higher fiscal deficits into the future, something the U.S. can’t afford with the government already generating annual $1T+ deficits.
Did Powell signal higher rates in late August? My Hi-Lo indicator started to go negative about around then - chart attached.
I’ve also been reading about high corporate debt recently, but my custom series for aggregate debt/sales and debt/income don’t show anything alarming - at least from a historical point of view. But I do agree that between increasing interest rates and the ongoing US/China trade dispute, income growth may be hard to find. Add Georg’s seasonality w/ the mid-term election cycle kicker and, to me, the investing environment looks riskier.
I know it looks bloody out there, but I simply do not have a sell Signal, the rule: SP500 below 200MA (which is the case) and earnings trending down in real Terms (n. only slowing growth, which is the case). Up 7% YTD (in Euro Terms), DD -8.3%. also no lower low on capital curve