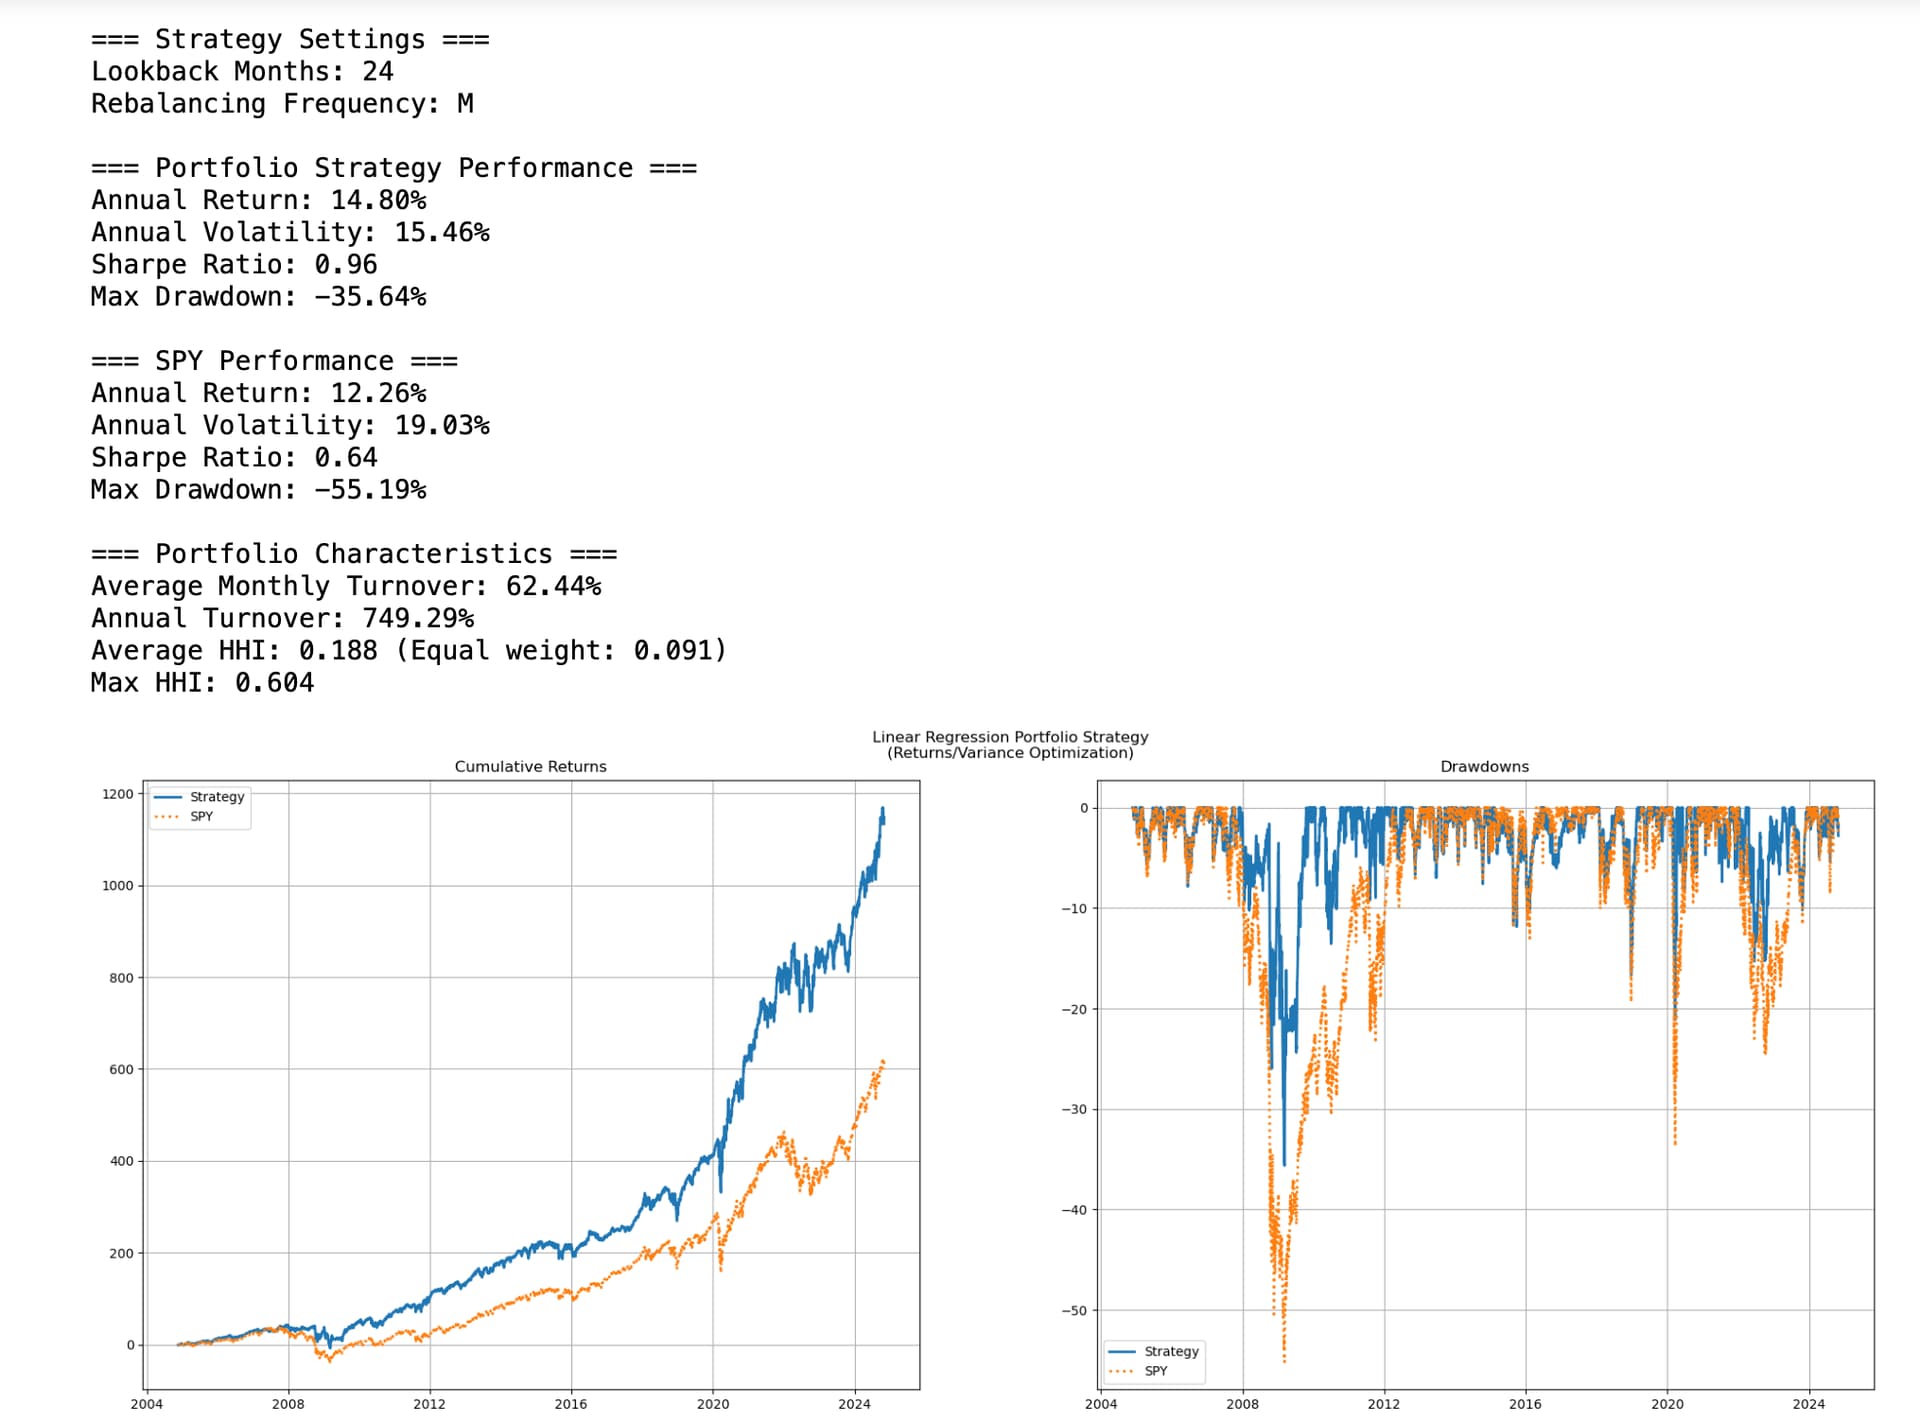
For those still interest in the Python version of this general idea, this code gives better returns but has problems with high turnover and getting overly concentrated at times with 60% of the portfolio being in one ETF at one point.
This is the same idea but uses Kelly Formula for continuous returns (Expected Return)/Variance. Expected return is determined using a linear regression model for this ETF string in the code: ["XLE", "XLU", "XLK", "XLB", "XLP", "XLY", "XLI", "XLV", "XLF", "TLT", "GLD"].
I think this has relevance to this discussion also. Relevance in that linear regression may be a more nuanced method for using trending and mean reversion in a model than some other methods for both sectors and factors: I really wish factor momentum would work - help me show that it actually does
Code for replication or if someone wants to modify it in an attempt make something useful of it (e.g., limit the turnover or concentration):
import numpy as np
import pandas as pd
import yfinance as yf
from sklearn.preprocessing import StandardScaler
from sklearn.linear_model import LinearRegression
from tqdm import tqdm
import matplotlib.pyplot as plt

class LinearRegressionPortfolioStrategy:
    def __init__(self, stock_tickers: list, benchmark: str = "SPY",
                 lookback_months: int = 24, rebalance_freq: str = 'M'):
        self.stock_tickers = stock_tickers
        self.benchmark = benchmark
        self.lookback_months = lookback_months
        self.rebalance_freq = rebalance_freq
        self.scaler = StandardScaler()

    def prepare_data(self, start_date: str, end_date: str) -> tuple:
        print("Downloading data...")

        start_date_with_buffer = pd.to_datetime(start_date) - pd.DateOffset(months=self.lookback_months)
        end_date = pd.to_datetime(end_date)

        bench_data = yf.download(self.benchmark, start=start_date_with_buffer, end=end_date, progress=False)
        if bench_data.empty:
            raise ValueError(f"No data available for benchmark {self.benchmark}")

        # Convert index to timezone-naive
        bench_data.index = bench_data.index.tz_localize(None)

        all_returns = pd.DataFrame(index=bench_data.index)
        all_returns[self.benchmark] = bench_data['Adj Close'].pct_change() * 100

        valid_stocks = []

        for ticker in tqdm(self.stock_tickers, desc="Downloading stocks"):
            try:
                stock_data = yf.download(ticker, start=start_date_with_buffer, end=end_date, progress=False)
                stock_data.index = stock_data.index.tz_localize(None)

                if not stock_data.empty:
                    returns = stock_data['Adj Close'].pct_change() * 100
                    if len(returns) >= len(bench_data.index) * 0.5:
                        all_returns[ticker] = returns
                        valid_stocks.append(ticker)
                    else:
                        print(f"Insufficient data for {ticker}, excluding from analysis")
            except Exception as e:
                print(f"Error downloading {ticker}: {e}")

        if not valid_stocks:
            raise ValueError("No valid stocks found")

        print(f"\nUsing {len(valid_stocks)} stocks: {', '.join(valid_stocks)}")
        return all_returns.dropna(), valid_stocks

    def predict_returns(self, data: pd.DataFrame, stock: str, current_idx: int) -> float:
        dates = data.index
        current_date = dates[current_idx]

        month_start = pd.Timestamp(current_date.year, current_date.month, 1)
        prev_month_end = month_start - pd.Timedelta(days=1)
        lookback_start = (prev_month_end - pd.DateOffset(months=self.lookback_months))

        mask = (dates > lookback_start) & (dates <= prev_month_end)
        monthly_data = data[mask][stock].resample('M').last()

        if len(monthly_data) < 2:
            return 0.0

        X = np.arange(len(monthly_data)).reshape(-1, 1)
        y = monthly_data.values

        model = LinearRegression()
        model.fit(X, y)

        next_X = np.array([[len(monthly_data)]])
        prediction = model.predict(next_X)[0]

        return prediction

    def calculate_weights(self, data: pd.DataFrame, valid_stocks: list, current_idx: int) -> pd.Series:
        stock_metrics = []

        dates = data.index
        current_date = dates[current_idx]
        month_start = pd.Timestamp(current_date.year, current_date.month, 1)
        prev_month_end = month_start - pd.Timedelta(days=1)
        lookback_start = prev_month_end - pd.DateOffset(months=self.lookback_months)

        for stock in valid_stocks:
            predicted_return = self.predict_returns(data, stock, current_idx)

            mask = (dates > lookback_start) & (dates <= prev_month_end)
            monthly_data = data[mask][stock].resample('M').last()
            variance = monthly_data.var()

            if variance > 0:
                ratio = predicted_return / variance
            else:
                ratio = 0

            stock_metrics.append({
                'stock': stock,
                'predicted_return': predicted_return,
                'variance': variance,
                'ratio': ratio
            })

        metrics_df = pd.DataFrame(stock_metrics)
        total_ratio = metrics_df['ratio'].sum()

        if total_ratio != 0:
            weights = pd.Series(
                [metric['ratio'] / total_ratio for metric in stock_metrics],
                index=valid_stocks
            )
            weights[weights < 0] = 0
            if weights.sum() > 0:
                weights = weights / weights.sum()
            else:
                weights = pd.Series(1.0 / len(valid_stocks), index=valid_stocks)
        else:
            weights = pd.Series(1.0 / len(valid_stocks), index=valid_stocks)

        return weights

    def run_strategy(self, data: pd.DataFrame, valid_stocks: list) -> pd.DataFrame:
        print("Running strategy...")

        stock_weights = pd.DataFrame(0.0, index=data.index, columns=valid_stocks)
        portfolio_returns = pd.Series(0.0, index=data.index)

        rebalance_dates = pd.date_range(
            start=data.index[0],
            end=data.index[-1],
            freq=self.rebalance_freq
        )

        rebalance_dates = rebalance_dates[rebalance_dates.isin(data.index)]

        initial_periods = self.lookback_months * 21
        initial_weight = 1.0 / len(valid_stocks)
        first_rebalance_idx = data.index.get_loc(rebalance_dates[0])
        stock_weights.iloc[:first_rebalance_idx] = initial_weight

        for t in range(first_rebalance_idx):
            portfolio_returns.iloc[t] = (stock_weights.iloc[t] * data[valid_stocks].iloc[t]).sum()

        current_weights = pd.Series(initial_weight, index=valid_stocks)

        for t in tqdm(range(first_rebalance_idx, len(data)), desc="Computing strategy"):
            current_date = data.index[t]

            if current_date in rebalance_dates and t >= initial_periods:
                current_weights = self.calculate_weights(data, valid_stocks, t)

            stock_weights.iloc[t] = current_weights
            portfolio_returns.iloc[t] = (current_weights * data[valid_stocks].iloc[t]).sum()

        return pd.DataFrame({
            'returns': portfolio_returns,
            **stock_weights
        })

    def analyze_portfolio(self, start_date: str, end_date: str):
        try:
            data, valid_stocks = self.prepare_data(start_date, end_date)

            # Trim the data to the requested period after using lookback
            start_date_dt = pd.to_datetime(start_date).tz_localize(None)
            data = data[data.index >= start_date_dt]

            results = self.run_strategy(data, valid_stocks)

            cum_strategy = (1 + results['returns']/100).cumprod()
            cum_benchmark = (1 + data[self.benchmark]/100).cumprod()

            rolling_max_strategy = cum_strategy.expanding().max()
            rolling_max_benchmark = cum_benchmark.expanding().max()
            drawdown_strategy = (cum_strategy - rolling_max_strategy) / rolling_max_strategy * 100
            drawdown_benchmark = (cum_benchmark - rolling_max_benchmark) / rolling_max_benchmark * 100

            strategy_returns = results['returns']
            benchmark_returns = data[self.benchmark]

            strategy_ann_return = (1 + strategy_returns.mean()/100)**252 - 1
            benchmark_ann_return = (1 + benchmark_returns.mean()/100)**252 - 1

            strategy_ann_vol = (strategy_returns/100).std() * np.sqrt(252)
            benchmark_ann_vol = (benchmark_returns/100).std() * np.sqrt(252)

            strategy_sharpe = strategy_ann_return / strategy_ann_vol
            benchmark_sharpe = benchmark_ann_return / benchmark_ann_vol

            # Calculate turnover
            weights_diff = results[valid_stocks].diff().abs()
            turnover = weights_diff.sum(axis=1)
            avg_monthly_turnover = turnover[turnover != 0].mean()
            annual_turnover = avg_monthly_turnover * 12

            # Calculate concentration (HHI)
            hhi = (results[valid_stocks] ** 2).sum(axis=1)
            avg_hhi = hhi.mean()
            max_hhi = hhi.max()
            min_hhi = 1/len(valid_stocks)

            print("\n=== Strategy Settings ===")
            print(f"Lookback Months: {self.lookback_months}")
            print(f"Rebalancing Frequency: {self.rebalance_freq}")

            print("\n=== Portfolio Strategy Performance ===")
            print(f"Annual Return: {strategy_ann_return*100:.2f}%")
            print(f"Annual Volatility: {strategy_ann_vol*100:.2f}%")
            print(f"Sharpe Ratio: {strategy_sharpe:.2f}")
            print(f"Max Drawdown: {drawdown_strategy.min():.2f}%")

            print(f"\n=== {self.benchmark} Performance ===")
            print(f"Annual Return: {benchmark_ann_return*100:.2f}%")
            print(f"Annual Volatility: {benchmark_ann_vol*100:.2f}%")
            print(f"Sharpe Ratio: {benchmark_sharpe:.2f}")
            print(f"Max Drawdown: {drawdown_benchmark.min():.2f}%")

            print("\n=== Portfolio Characteristics ===")
            print(f"Average Monthly Turnover: {avg_monthly_turnover*100:.2f}%")
            print(f"Annual Turnover: {annual_turnover*100:.2f}%")
            print(f"Average HHI: {avg_hhi:.3f} (Equal weight: {min_hhi:.3f})")
            print(f"Max HHI: {max_hhi:.3f}")

            fig, ((ax1, ax2), (ax3, ax4)) = plt.subplots(2, 2, figsize=(20, 15))
            fig.suptitle('Linear Regression Portfolio Strategy\n(Returns/Variance Optimization)')

            cum_strategy_plot = (cum_strategy - 1) * 100
            cum_benchmark_plot = (cum_benchmark - 1) * 100
            ax1.plot(data.index, cum_strategy_plot, label='Strategy', linewidth=2)
            ax1.plot(data.index, cum_benchmark_plot, label=self.benchmark, linestyle=':', linewidth=2)
            ax1.set_title('Cumulative Returns')
            ax1.grid(True)
            ax1.legend()

            ax2.plot(data.index, drawdown_strategy, label='Strategy', linewidth=2)
            ax2.plot(data.index, drawdown_benchmark, label=self.benchmark, linestyle=':', linewidth=2)
            ax2.set_title('Drawdowns')
            ax2.grid(True)
            ax2.legend()

            for stock in valid_stocks:
                ax3.plot(data.index, results[stock], label=stock, alpha=0.7, linewidth=1)
            ax3.set_title('Portfolio Weights Evolution')
            ax3.grid(True)
            ax3.legend(bbox_to_anchor=(1.05, 1), loc='upper left')

            ax4.plot(data.index, turnover * 100, label='Monthly Turnover', color='blue', alpha=0.7)
            ax4_twin = ax4.twinx()
            ax4_twin.plot(data.index, hhi, label='HHI', color='red', alpha=0.7)
            ax4.set_title('Portfolio Turnover and Concentration')
            ax4.set_ylabel('Monthly Turnover (%)', color='blue')
            ax4_twin.set_ylabel('HHI', color='red')
            ax4.grid(True)

            lines1, labels1 = ax4.get_legend_handles_labels()
            lines2, labels2 = ax4_twin.get_legend_handles_labels()
            ax4_twin.legend(lines1 + lines2, labels1 + labels2, loc='upper right')

            plt.tight_layout()
            plt.show()

            return results

        except Exception as e:
            print(f"Error in portfolio analysis: {str(e)}")
            return None

if __name__ == "__main__":
    stocks = ["XLE", "XLU", "XLK", "XLB", "XLP",
              "XLY", "XLI", "XLV", "XLF", "TLT", "GLD"]

    portfolio = LinearRegressionPortfolioStrategy(
        stocks,
        lookback_months=24,
        rebalance_freq='M'
    )
    results = portfolio.analyze_portfolio("2001-01-01", "2024-11-01")