A question for the P123 team

I appreciate the effort Marc.

The problem arises:

  • because we use this ratio to rank stocks.
  • because (a-b)/abs(b) does NOT work when a and b are of different signs.

Take ticker APD since a and b are of different signs in this case. a= 3.08% and b =-2.65 %. OK ?

According to formula (a-b)/abs(b) Eps acceleration = 216 % right ?

Now suppose b were to be -26.50%. The formula would give 111 %

Do you see anything wrong here ?

This is one of the thing my chart shows.

My formula 2^a/2^b allows to RANK and COMPARE stocks between themselves whatever signs their a and b are. It’s not a calculation of the absolute value of EPS acceleration. The value of EPS acceleration can never be calculated when a and b are of different signs.

An example:

Stock1. a=3.08% b=-26.5%. (a-b)/abs(b) = 111%. 2^a/2^b = 1,23
Stock2. a=3.08% b=-2.65%. (a-b)/abs(b) = 216%. 2^a/2^b = 1,04
Stock3. a=3.08% b=+0.2%. (a-b)/abs(b) = 1440%. 2^a/2^b = 1,02
Stock4. a=3.08% b=+2.65%. (a-b)/abs(b) = 16%. 2^a/2^b = 1,00

In reality stock 1 has a greater EPS acceleration than stock 2 and than stock 3 and stock 4.
(a-b)/abs(b) gives stock 3 as a winner, then stock 2, then stock 1, then stock 4. It’s simply not the case. Do you see it ?

2^a/2^b works like a charm :slight_smile:

Additionally you can compare the behavior when b hovers around zeros of the two formulas.


I’m not considering the latest chart. I said I don’t get them, and simply piling on more is starting to annoy the sh** out of me.

As to the numerical examples, these I can and will discuss.

let’s look at this one:

Stock3. a=3.08% b=+0.2%. (a-b)/abs(b) = 1440%. 2^a/2^b = 1,02

The actual growth rate is 1440%. We have to show it. If we were to do otherwise, if we were to show a 2% growth rate as tour approach suggests, we’d be rightly crucified by pretty much every other present and prospective subscriber. So in terms of calculating growth rate, we will not adopt your suggestion. Case closed on this issue.

Moving on, the only comparably clear-cut obviously correct solution when negative numbers enter the picture would be to show NM. It would certainly be defensible, but I suspect many subscribers would find it very unsatisfying. So now, we’re forced out of the realm of being absolutely positively indisputably correct and into the realm of opinion, of workable approximation. In that regard, the (a-b)/abs(b) formula has been used widely and beyond p123 and with pretty satisfying results. And an important virtue of this approach is that this bit of logic will produce correct growth rates 100% of the time when we have two positive numbers, when there is a clear-cut right and wrong.

So, while (a-b)/abs(b) may not be the penultimate answer and while we can and do hold out hope someone somewhere some day will offer a better approach, we know for sure 2^a/2^b is not it – because it produces clear-cut and very dramatic “errors” in the mainstream aspect of the growth-rate question, the one where we have positive numbers in both parts of the fraction. So while it would be great if we were to eventually get a better crossing-zero growth-rate solution, the notion that p123 might revise its platform to computer growth rates based on 2^a/2^b is a non-starter. It’s not going to happen.

The good news, however, is that p123 is a stupendous platform that gives individual users considerable power to come up with creative solutions to better address specific problems than is the case with standard offerings. We’re not Apple. We don’t tell you that it has to be our way or the highway. We’re 180 degrees opposite. We’re thrilled and proud when our members come up with creative solutions. We may not always be able to adopt them as platform-wide standards, but we love to see members using them on their own and profiting and/or building a reputation by publicizing their ideas. This is where your work with 2^a/2^b fits in. You aren’t a platform that must accommodate a very wide variety of needs. You are an individual looking to solve a problem that impacts your own work (in this case, a best-to-worst ranking based on a ratio that is often plagues by mixed signs). Since you’re addressing a specific rather than general need, you need not be concerned by the areas where 2^a/2^b would produce bad answers. You are able to restrict the formula’s use to only areas where it works well. In other words, you, as an individual are freedom to do many more things than p123 – a platform, not an individual – can do; or at least you remain free to do so unless or until Apple acquires p123 (a joke – let’s not have anybody getting carried away here) in which case you would probably be banned from using your formula because the late Steve Jobs didn’t come up with it.

I think the near zero problem is important. That having been said I have not found anything better than (a-b)/abs(b) yet.

If you just want something that crosses 0 without blowing up (a-b) fits the bill but does not improve my ranking system: worse as you all know.

A good way (I thought) to address the issue is with a composite node.
Formula 1: (a-b)/abs(b)
Formula 2: (a-b)
My thinking was that if a stock shows an extreme percentage change but a small absolute change it will be lowered in rank (desired). This performed about the same as (a-b)/abs(b) with all reasonable weights.

2^a/2^b has not improved my ranking systems. I’m still looking for an improvement: I am looking mainly at analyst revisions with this formula.

I appreciate all the discussion and ideas.

Yes actually 2^A/2^B is no miracle solution either since it only works for a fixed A and varying B but not for varying A and varying B.
Bummer.

Just one reminder: Improving your ranking systems is not the goal. What you really want to do is improve your results. You can accomplish a lot with an imperfect ranking system that’s part of a model that includes screening/buy rules that filter out the kinds of situations least likely to mesh with the ranking system. IOW, don’t sweat so much about near-zero denominators when it comes to ranking systems; instead, filter them out with screening/buy rules.

Right on. That’s what I do. Although I use the ABS() function in my EPS ratio for the ranking, I add a buy rule just to make sure. My buy rule is probably redundant, but it does help my confidence.

Brian

I am coming to this discussion a bit late but I have two approaches to measure growth rate depending on what is being measured.

If the two numbers are not ratios (for example EPSPSQ/EPSPSPYQ) then I like to use (a-b)/c. c is a third number and is used to provide some perspective. For example if EPS went from -.02 to .02 then it went up by 4 cents per share. Is that a lot or a little? It depends on the size of the company and the number of shares outstanding. For a company the size of Apple it’s a drop in the bucket. But for a tiny company with lots of shares outstanding then 4 cents per share can be very substantial. So c could be SalesPS or whatever. I am starting using (a-b)/abs(b) less and less because it doesn’t work very well as b approaches 0.

If the two numbers are themselves ratios then measuring the rate of change is different. Using a/b is meaningless for negatives. (a-b)/abs(b) does not work well when b approaches zero. What about using (a-b)/c? That could work but what should we use for c? For example if EPS%ChgPYQ is 15 and EPS%ChgTTM is 10 then a-b = 15-10 which is 5. Is that a lot or a little? It depends on the rest of the universe. If it’s 2008 and the eps of most companies are dropping off a cliff then it’s great, but if it’s the end of 2009 and many companies are growing by leaps and bounds then 5 is not much. So it depends on the universe. That’s simply like a-b compared to universe.

Wouldn’t this work?

My opinion is that the classic formula; (a-b)/Abs(b) is, in general, the correct and best formula to use for almost any ratio, but this ratio of a ratio, although mathematically correct makes little sense to me for all 3 formulas discussed above since they are basically useless. There is no alpha for any of the formulas except for a 3 or 6 month rebalance period, and even very little alpha then.

Look at each formula separately by creating a single function ranking system and run the performance using various rebalance periods and different number of buckets. For either the S&P 500 or the Russell 2000 stocks, there is effectively no alpha. So I wouldn’t include any of these ratios in a ranking system. If there is no alpha, why bother.

Denny :sunglasses:

Perhaps the first sentence of the second paragraph explains why you’re not seeing any alpha. On a single factor ranked basis, there may not be any. But that’s like writing a review of War and Peace based only on a reading of Chapter 1. There’s a lot more out there. Alpha comes from strategies, ideas, etc. If you can nail something that can be expressed in a single rank factor, great. But combinations of rank factors, and combinations of ranking systems with screening or bu/sell rules dramatically expands the palate and the range of potential alpha-producing ideas.

And by the way, there’s nothing wrong with a 3 or 6 month rebalance. Some investment idea can come to fruition in 1 week. But many others need more time.

Hi Denny, I didn’t find too much alpha in earnings acceleration either. I use my formulas to measure other fundamental trends similar to the Piotroski ranking system. I have found that a-b works marginally better than (a-b)/ABS(b) to measure some of those trends in ratios. I think that conceptually a-b may make more sense in that context. If b is zero then it is obviously better. But even when b is close to zero or negative then the standard formula can give misleadingly high results.

Marc,

I agree; there MAY be some trading systems that can get alpha from the above functions, but EVERY ranking system I tried to develop using it had higher returns after I removed it from the system or by setting its weight to 0. Just saying, it hasn’t worked for me.

Anyone out there have a system that is improved by adding earnings acceleration?

Denny :sunglasses:

The last two words are the key to that sentence.

Yeah, me . . . the first model I looked at after taking on your “challenge.”

There are two acceleration factors in the Growth component of the pre-set QVGM ranking system, which is included in the model I use for the Forbes Low-Priced Stock Report (and in which I invest real money). I just created an alternative version sans the Growth factors. I then checked the performance during the live period (7/15/10-present) of the strategy and saw that eliminating acceleration reduces performance by about 300 basis points per year.

As to the QVGM ranking system in and of itself model in itself – separate and apart from any screening rules with which one might surround it – one might argue that the two versions performed approximately the same with the acceleration factors and without them using what I suppose are some fairly generic testing protocols: Max period, NA is Negative, All Fundamentals universe, 4 week rebalancing, and 20 buckets. (Beauty is in the eye of the beholder so I can envision someone making a case for one or the other, but I doubt any identifiable differences would be statistically significant.) Confining the ranking system test to the live period (7/15/10 – present), again, the performance differences don’t seem dramatic, but ironically, it would seem a bit easier to argue in favor of the alternate (sans acceleration) version, which is at odds for the performance of the complete model.

Enough talk about factor testing. As you and others probably know from prior posts of mine, I’m deeply opposed to that style of strategy development. I believe that successful (live) strategies spring from common sense application of sensible investing principles and that testing is a feedback mechanism to help us assess our success or lack thereof in translating such ideas into the sort of language a computer platform can understand and apply. So let’s talk about the role of acceleration in that context.

The starting point is that growth is good. We see that behaviorally. And we see that in just about any theoretical model one might find, wherein increases in g are associated with higher P. So it stands to reason that acceleration (growth of growth, or super g) ought to also be good: more g at the end of the day leading, all else being equal, to more P.

But there are two potential traps (which were probably picked up in the results of your single-factor testing). One is the company lifecycle (in a big picture sense) and mean reversion (in a little picture sense). Both point to dangers of extrapolating g and super g (acceleration) into the future. If we’re going to use super g in a model, we’ll need to use it in conjunction with other factors that give us reason to assume historically observed super g for the companies we pick are not about to turn around on us. Another trap is valuation. Academic research has actually shown that strong rates of even basic growth – not just strength in super g – can restrain share price performance not just because growth trends can reverse (we can almost argue that there’s a presumption that strong growth trends will reverse) but also because high growth tends to be more associated with overvaluation. So if we’re going to use super g in a model, we’re also going to have to pull in a good dose of valuation.

So right at the outset, without even logging on to the p123 web site, I already know that acceleration, in and of itself, is likely to be unsuccessful as an investing strategy. That’s where your testing comes in. Your results confirm the obvious. But the same principles that led me to know what you’d find even before you found it also tell me that acceleration can work (based on the g-is-good-so-super-g-should-be-better notion) if we are able to control for the dangers of life-cycle-mean-reversion and excess valuation. To do that on p123, we’d need to use acceleration not as a strategy in and of itself but as part and parcel of a more comprehensive strategy that at the very least, includes factors that mitigate the aforementioned dangers. This is one example of why I tend to prefer ranking systems with larger numbers of factors (notwithstanding the quant preferences for fewer factors – I tend to be very careful about so-called quantitative/statistical best practices because they often reflect questionable “domain knowledge”) and why I don’t get too carried away by ranking system tests, preferring instead to judge the merits of ranking systems as inseparable components of complete models which include screening/buy/sell rules, which in my opinion are every bit as important (possibly even more important) and warrant every bit as much attention as raking systems. Apparently, my newsletter model has been able to control for the dangers of acceleration to a sufficient degree to allow it to enjoy its benefits.

Finally, I would strongly caution anyone against using the logic proposition: I haven’t been able to make this work therefore it doesn’t work. This is the argumentum ad ignorantiam fallacy, which assets that a proposition is false because it hasn’t been proven true (or vice versa).

This logical fallacy is, actually, a critical part of the foundation on which p123 stands. There is a massive amount of empirical research purporting to prove that nobody can beat the market and that we should all simply invest passively. But all of it, each and every study, suffers from this same fallacy. All each researcher has actually proven is that HE can’t beat the market; none of the research is grounds to infer that the market can’t be beaten; a scenario that should be close to the heart of everyone on p123. So anyone who has ever profited from a market-beating model built on p123 (I hope that would be all of us) should be especially careful to refrain from ever saying or suggesting that something can’t work because it didn’t work for me.

Marc,
It wasn’t a challenge. I was curious to see if anyone had had any success with that formula since as of yet I had not.

I didn’t make a feverous statement based on little testing on my part. It was based on testing I had made a number of years ago including in the P123 QCGM ranking system. I also had re-checked a few conditions of the formula yesterday before I made the above post to see if I had a memory error.

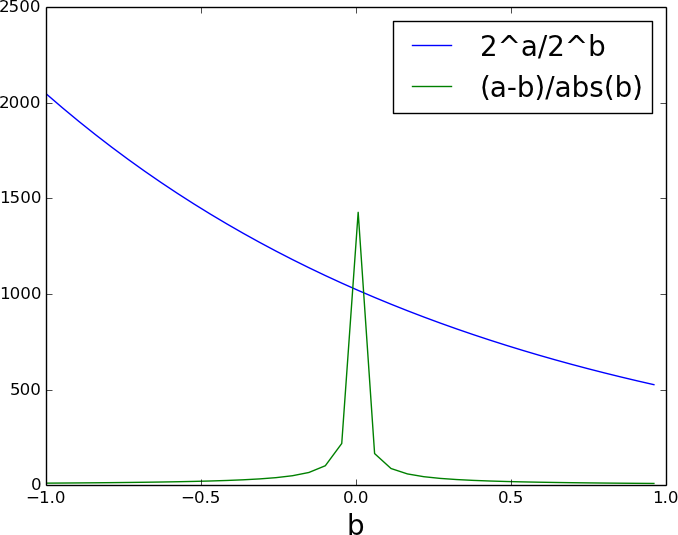
The P123 QVGM ranking system has 2 areas in which acceleration is used. It is uses in the EPS node which has 2 sub-nodes; Basic and Acceleration. In the accel node it is used as a short term function; (EPS%ChgPYQ- EPS%ChgTTM)/abs( EPS%ChgTTM), and as a longer term function; ( EPS%ChgTTM- EPS5YCGr%)/abs( EPS5YCGr%). It is also uses in the Sales node as a short term function; (Sales%ChgPYQ- Sales%ChgTTM)/abs( Sales%ChgTTM), and as a long term function; ( Sales%ChgTTM- Sales5YCGr%)/abs( Sales5YCGr%). the Sales node also has a Basic sub-node.

I made a copy of the P123 QCGM Ranking system and changed the weighting of the EPS Acceleration node to 0 and the Basic node to 100 (called QVGM – EPS accel below) So that the EPS node would have the same weight as before, just minus the accel functions. I also made a copy of that copy were I set the Sales, Acceleration mode to 0 and the Sales Basic node to 100 (called QVGM –EPS & Sales accel below).

I then ran a series of tests comparing the 3 ranking systems through various time periods, using various rebalance periods, and number of buckets. So here is what I found today testing the P123 QCGM ranking system and my 2 copies. In the below test results there are no changes except for the ones I stated:

First I set the ranking system performance to 20 buckets, 4 weeks starting in 01/02/99, I use Prussell 3000 so it wouldn’t buy any illiquid stocks. Here are the results in the top bucket:
QVGM = 15.5, QVGM – EPS accel = 15.3, QVGM –EPS & Sales accel = 15.3; so acceleration adds a little performance in this case.

Next I wanted to see the effect in the top bucket using 100 buckets assuming that a sim would buy from the top 1% to replace a sold stock:
QVGM = 18.8, QVGM - EPS accel = 18.1, QVGM –EPS & Sales accel = 19.2; Hum…. EPS accel helps, but Sales accel hurts performance.

Next I wanted to test out of sample as Marc indicated above from 07/15/10 > 04/19/2014;
QVGM = 24.6, QVGM- EPS accel = 24.3, QVGM –EPS & Sales accel = 23.0; so in out of sample, accel adds performance.

Next I started at the beginning of the current bull market 03/09/2009 > 04/19/2014;
QVGM = 25.2, QVGM – EPS accel = 25.2, QVGM –EPS & Sales accel = 26.7; Hum… EPS accel adds no improvement, But again Sales accel hurts performance.

Next I wanted to see the effect of accel during the last recession 10/12/07>03/09/09;
QVGM -49.5, - EPS accel -49.0, QVGM –EPS & Sales accel = -48.6; Hum… accel hurts. That’s counter-intuitive. I would have thought that if it helped anywhere it would be during a recession.

I wanted to check 1 week rebalance during the recession;
1 week QVGM -41.7, - EPS accel -41.2, QVGM –EPS & Sales accel = -41.8; What? EPS accel helps, but sales accel hurts?

Next I wanted to check a 3 month rebalance which showed an improvement for the single factor accel function;
3 months; QVGM = -56.9; QVGM – EPS accel = -56.9, QVGM –EPS & Sales accel = -56.9; No change? I better check that again… yep, no change.

Well how about a 1 week rebalance from the beginning 01/02/1999.
QVGM = 21.2, QVGM – EPS accel = 20.9, QVGM –EPS & Sales accel = 21.0; OK, accel helps a little here.

Ok since accel helps for that case, how about 3 months rebalance.
QVGM = 12.5, QVGM – EPS accel = 12.7, QVGM –EPS & Sales accel = 12.7; What?, I thought accel helped for a single factor ranking system and 3 months rebalance.

What’s the bottom line? Sometimes it helps, sometimes it doesn’t. In either case the difference is not very much.

Does anyone else have an example where there is obvious improvement? It always made sense to me that it should help, but I haven’t found where yet.

Denny :sunglasses:

Denny,

What was the point of all that testing? All you did was confirm what I already said:

“As to the QVGM ranking system in and of itself model in itself – separate and apart from any screening rules with which one might surround it – one might argue that the two versions performed approximately the same with the acceleration factors and without them using what I suppose are some fairly generic testing protocols: Max period, NA is Negative, All Fundamentals universe, 4 week rebalancing, and 20 buckets. (Beauty is in the eye of the beholder so I can envision someone making a case for one or the other, but I doubt any identifiable differences would be statistically significant.) Confining the ranking system test to the live period (7/15/10 – present), again, the performance differences don’t seem dramatic, but ironically, it would seem a bit easier to argue in favor of the alternate (sans acceleration) version, which is at odds for the performance of the complete model.”

More importantly, all that work was useless. This is not about how intensively one can analyze ranking system backtest results. Nothing counts – NOTHING – except out of sample performance of FULL models of which a ranking system is one component (and may or may not be the most important component, depending on the designer’s approach). The out-of-sample outcome of my live model was clear and indisputable: Acceleration added about 300 basis points per year to performance. Case closed for that model. Each other model (model, not ranking system) would have to be evaluated separately.

WTF! It’s not simply a sometimes-this-and-sometimes-that sort of thing. The answer flows logically from a common-sense understanding of basic principles. As I explained, “acceleration can work (based on the g-is-good-so-super-g-should-be-better notion) if we are able to control for the dangers of life-cycle-mean-reversion and excess valuation.”

Yes, and in my post I explained the rationale: “the g-is-good-so-super-g-should-be-better notion.”

And you won’t/can’t until you “control for the dangers of life-cycle-mean-reversion and excess valuation,” which you have not done, or at least not effectively. In my case, I had already indicated that the complete QVGM wasn’t enough to accomplish the job. I needed the screening factors.

A big problem in what you’re doing, in my opinion, is an excessive exaltation of the ranking system. It’s an interesting debate as to which is primary, the ranking system or the screen. Every principle put into a ranking system is subject to a set of common sense principles comparable in influence to what I described for acceleration, meaning there are circumstances under which one should expect the factor to fail. Use of multiple factors in a ranking system can and often does help a lot in controlling for such circumstances, but use screening tools can be especially powerful in this regard. Again, it’s not about the ranking system: It’s about the complete model.

X

Marc,

I am not arguing against acceleration, I was asking for help. I am trying to find situations where it helps in a ranking system and/or Sim. I have been a proponent of acceleration functions for years because it makes so much sense. But so far I haven’t found a way to use it to achieve the potential I feel should be there. The point of “all that testing” was to try and understand how and when and under what context the Acceleration functions might work.

I totally agree that nothing counts but out of sample, but how do we get to out of sample without testing ideas to find out how and when and under what context the ideas might imply good out of sample performance? Again, I am looking for examples.

Wonderful! What live model? Is it a Port, a Screen? Where is it? I can’t find it. How can it be used?

Seriously, was that necessary? I spend a LOT of time on the Forum trying to help members with P123 questions, but when I ask for help, you do that?

OK, I believe you, but that doesn’t help at all with how to apply acceleration.

OK, any examples of that?

Marc, I really, really think Acceleration will work, but unable to come up with “the right combination” I gave up on it a few years ago. This thread rekindled my desire to try again, but so far there is nothing I can use.

Denny

@Denny,

Try with this kind of statement:

Eval((EPS%ChgPYQ/EPS%ChgTTM)<0,NA,(EPS%ChgPYQ- EPS%ChgTTM)/abs( EPS%ChgTTM))

Let me know if you do. I’ve seen improvement most of the time, not always though.

I can’t share that particular model since it is proprietary to the newsletter. But there’s more than one way to skin a cat (probably a gazillion ways) and a quickie test suggests we can talk about an approximately similar model that is one of the p123 pre-sets. Let’s work with the one entitled “Stocks Priced Below $3.” It uses QVG instead of QVGM but I did the same thing with QVG; I created an alternate version sans acceleration. I don’t remember exactly when I created the Below-3 screen, but I’m guessing a five-year backtest is entirely or largely out of sample. And I got pretty much the same results as with the proprietary model, with removal of acceleration having subtracted about 300 basis points (actually, the difference is 364 BP).

Like I said, if we want to use acceleration, we need to control for two dangers. The first, valuation, is handled in these models by the V part of QVG or QVGM. There’s nothing holy about that specific approach to value; I’m sure countless other variations one might come up with as rank factors and/or screening rules can suffice. But as we learned when QVGM was examined in isolation, this particular approach to V can’t suffice on its own. We really do need to somehow or other get at the means-reversion issue.

This is an interesting challenge, one of the fun ones since p123 necessarily uses data from the past, but we’re especially wired right now (more so than usual since we’re suing the potentially dangerous mean-reverting acceleration factor) to wonder about whether that past data will be relevant to our future performance. We can’t get at it directly since all direct use of data deals with the past. So we need to outfox the data.

This specific screen accomplishes that through the OR-using alternative rule that requires 5-year ROA, ROE or ROI to be above industry average. Metrics such as these are valuable way above and beyond what the standard textbooks suggest. What the textbooks don’t usually say – but what’s so vital to folks like us – is the fact that these metrics tend to far more predictable than most. While individual situations are apt to be all over the place, as with everything else, we tend to see in the aggregate that companies tend to stay pretty stable from year to year subject to the proviso that extreme tallies (in both directions) tend to very gradually revert toward some sort of norm. How we define the norm is debatable but we need not tackle that now. What’s important is the general level of trend sustainability.

So here’s what tri-part test, in effect, says about the accelerators; it tells us that such acceleration as they’ve shown is less likely to be out of proportion to the characteristics of the business. If EPS were accelerating but ROE deteriorating, that could be a sign of danger since the more predictable metric is telling us that however much sales or eps acceleration is taking place, the company is having to invest an even more rapidly accelerating level of capital to get it done; that would be a prescription for unsustainability.

Now, I recognize my three-part rule is not precisely tuned (logically speaking) to what I want to know about acceleration. (To do that, I’d probably had to have developed some sort of rules to track and assess changes in ROE, ROA and/or ROI trends. And had I really intended to make acceleration the central focus of the model, I probably would have done that. But in this model, I wanted ROW (return on whatever) to carry a much broader burden. But often, at least the way I work, approximation is the name of the game (consistent with the adage attributed, albeit not accurately, to Keynes: It’s better to be approximately right than precisely wrong).

This is one possible solution. ROW, because of its generally stable character, can be a real and valuable workhorse for us. Technical analysis can be another one, but I’m using it differently from the way I expect more experts in this area would. My approach is gentler, so to speak. I’m not so much interested in the market telling me to buy and buy now (because I’m not really expert enough in this realm to develop such signals) as I am in the market telling me that the stock/company is at least respectable, not a total piece of you-know-what. Analyst and other sentiment data can probably help too. I’m starting to get deeply into earnings quality but I suspect that, too, could be a fruitful source of ideas for developing tests that capture the sustainability of acceleration. DSO and DSI, for example, night be worthwhile in this regard.

The proprietary model wasn’t quite the same as the one we looked at here. Gentle technical analysis played a bigger role there. Hopefully, though, this illustrates a general approach.

Denny, I like your Posts and Engagement here! Thank you for your great work in the p123 comunity!
Regards
Andreas