A relatively easy way to do fairly advanced machine learning at P123 now

Dan has posted a format for downloading a csv file with DataMiner in a separate post: Thank You Dan! - #5 by Jrinne

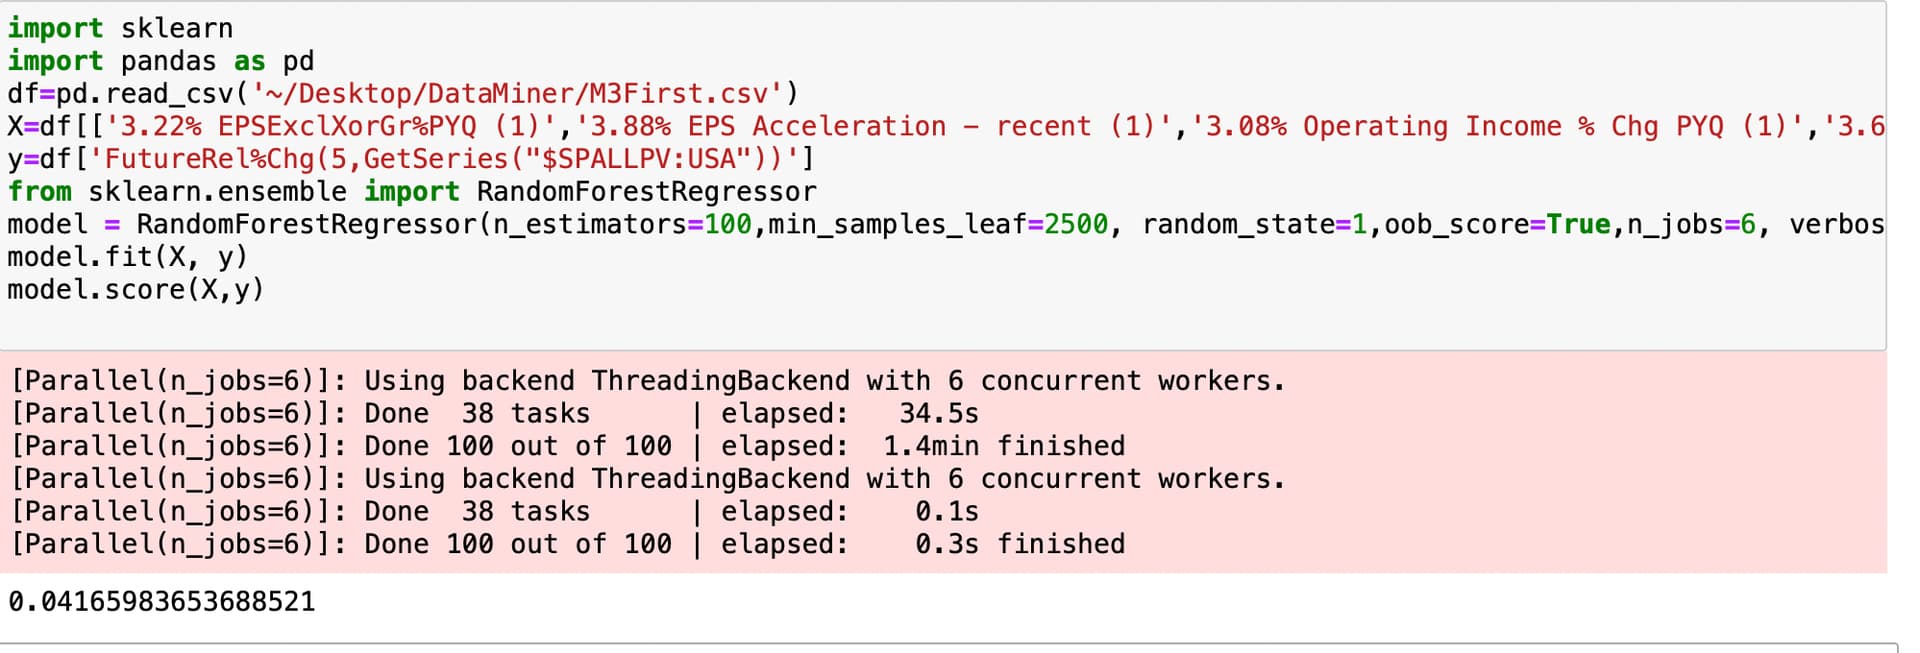
Here is an example of some code that could be used with that download to test a random forest model with the ultimate goal of finding a model that could be used with a P123 port. Obviously this is just one example of a huge number of machine learning methods available thru Scikit-Learn:

I modified Dan’s DataMiner code a little for my ranking system but nothing you couldn’t or wouldn’t do yourself. The machine learning model (if you liked it after using the code below) could be used to predict returns of stocks. It would only be 2 or 3 more lines of code to predict returns once you find a model you like. You could then sort the returns to get the tickers with the best expect returns over the next rebalance period. You might then enter those tickers into in-list for a port and have P123 rebalance the port and keep track of the returns for you.

I used the csv file generated by DataMiner and uploaded it into Python without changing anything including the names of the column-heads for the Pandas DataFrame.

You can look up the meaning of oob_score yourself without my boring you (and determine its value and significance here). To be honest, I did not have a lot of credits and oob_score was just the easiest to use and perhaps somewhat valid without a lot of data. I am not claiming it is the best method or one you would end up using if you do machine learning in the future. You will want to use other/additional tests of a machine learning method; no doubt about that.

Also I am sure that ChatGPT and Bard know what an oob_score is. They can explain this better than I could and help you with any additional coding you may be interested in for testing or validating a random forest or any other machine learning methods. And answer any additional questions you may be about machine learning that matter.

Only for those interested in machine learning and/or random forests. But you can see that is not a lot of coding (thanks to Dan doing most of the coding to get the Pandas DataFrame I needed).

Specifically, 3 lines of code once you upload the csv file, define the DataFrame and import the libraries.

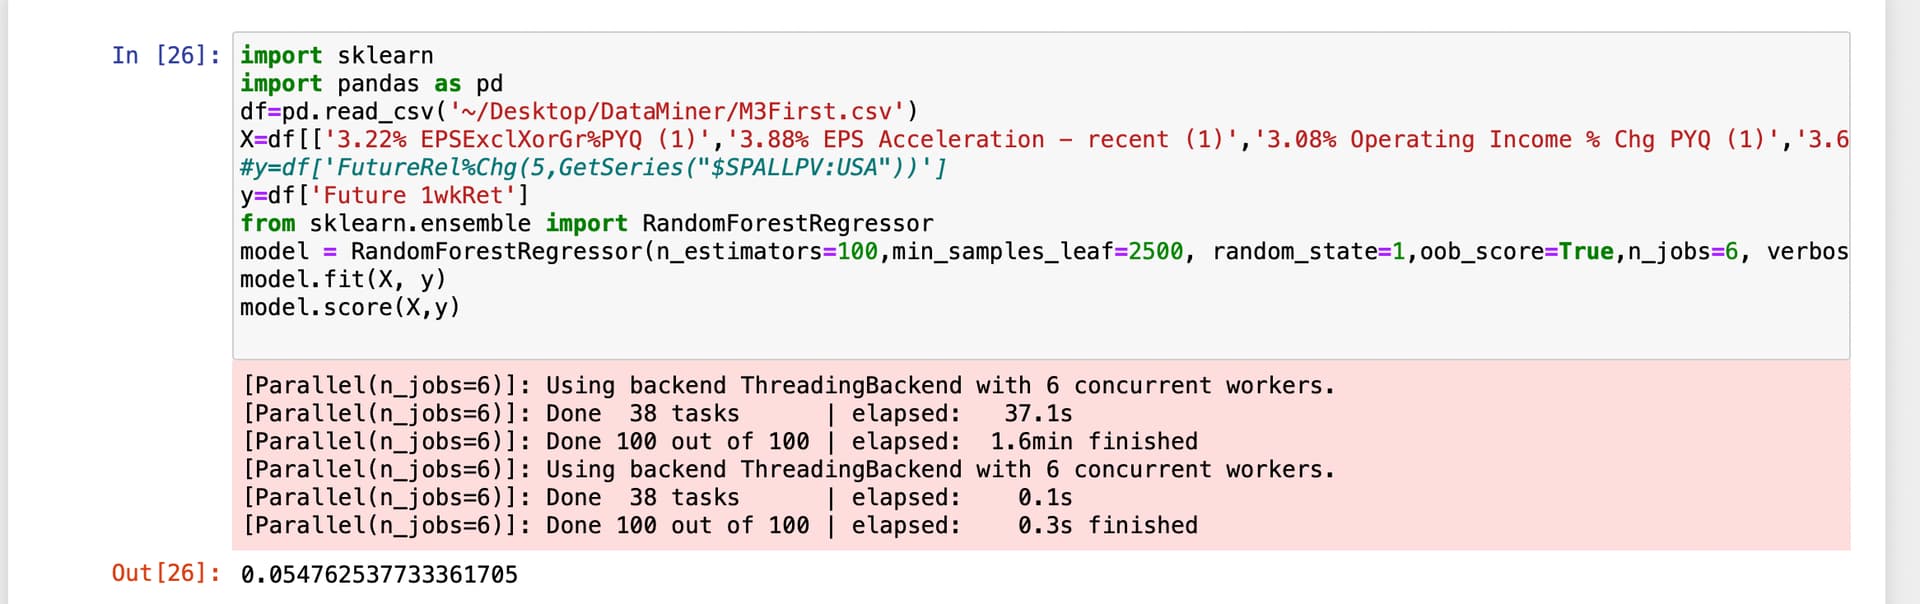
You should have no trouble getting started on your own model with ChatGPT’s help. But best of all is that you can find out for yourself what works for you with ChatGPT and Scikit-Learn. This is only one of a huge number of possible methods and not necessarily one that anyone (including me) would actually invest in:

Edit: I was surprised to find that raw returns gave a better oob_score than excres returns to this benchmark. IMHO, an oob_score of 0.055 is not bad for noisy stock data. But again this is a poor sample (I did not have a lot of P123 API credits). And I could learn a thing or two about machine learning still which I am working on this morning. A start and not a final anything but it would be nice if raw returns were adequate!!!:

Jim

I used this code on a hundred or so features (factors) and I got 7.8% in sample oob score but -1.5% oos. What did I miss?

Chipper,

Jim cant post right now due to temporary restriction from P123.

Based on my understanding from @Jrinne , he should be back next week if everything goes according to plan.

Regards
James

You should not be surprised since Random Forest high variance (difference between in-sample and out of sample). Would anyone really like to put big money to the black box system ?

Alternative approach to is to generate features that can capture non linearities between target and predictor and then use a linear model to control interpretability of the model.

Example:
for banking sector there is a ‘gap ratio’ : (rate sensitive assets - rate sensitive liabilities) / total earning assets. In general, either very low or very high values are associated with higher default rate for banks. See these examples:
rsa = 10, rsl =10, tea = 100 , gap ratio = 0
rsa = 5, rsl =10, tea = 100 , gap ratio = -0.05
rsa = 10, rsl =5, tea = 100 , gap ratio = +0.05
Random forest would capture this non-linear relationship, while a linear model would not. However, deep random forest model is unlikely to be interpretable to the desired extent.

The trick to to modify this ratio as:
abs ((rate sensitive assets - rate sensitive liabilities)) / total earning assets
then calculations are as follows:
rsa = 5, rsl =10, tea = 100 , gap ratio = +0.05
rsa = 10, rsl =5, tea = 100 , gap ratio = +0.05
Then you can use a fully interpretable model linear model (e.g., ridge/lasso) and to lower bias of your model (increase performance) while still keep variance at low level (assuming that your ratios are grounded in economic theory).

For non-banking sector there is a ratio of growth sales (mentioned by Yuval), where you like to select stocks with moderate sales growth only.

Hi Chaim,

Thank you for your interest. I am not entirely sure what code you are using but I can make some suggestions for improvements in my previous post in this thread. Also be aware that I have no preconceived notions of what will work best for you. Pitmaster has some good points. I recommend that you try his models too. I have.

  1. You will need to use excess returns relative to your universe I believe. This will reduce the noise in the data.

  2. oob_score or out-of-bag score is not a good cross-validation method in my opinion. I think it overfits and your would be better off with another validation method of you choosing.

  3. For unclear reasons sklearn change the default setting for random forests. I had missed that in the above post. Specifically max_features = None is now the defaul (max_features = ‘sqrt’ was the previous default). I think the present default is not the best for our purposes. I recommend max_features = ‘sqrt’.

  4. Finally, I find that sklearn’s Extra Tress algorithm runs much faster and gives me better results. The quality of the results is directly proportional to the quality of the features however. You cannot just throw in a bunch of feature of questionable importance into the extra trees regressor. I suggest you try both a random forest and and the extra trees method (I have commented out the extra trees regressor below but you can easily make a switch and try it).

Here is the pertinent code that I used just yesterday and seemed to get good results with my factors.

min_sample_leaf = 1000
max_features = ‘sqrt’
n_estimators = 2000
bootstrap = True

from sklearn.ensemble import ExtraTreesRegressor
from sklearn.ensemble import RandomForestRegressor
#regressor = ExtraTreesRegressor( bootstrap = bootstrap, n_estimators=n_estimators, min_samples_leaf=min_sample_leaf, max_features= max_features, criterion=‘friedman_mse’, random_state=1, oob_score=False, n_jobs=8, verbose=1)
regressor = RandomForestRegressor(n_estimators=n_estimators, min_samples_leaf=min_samples_leaf, max_features= max_features, criterion=‘friedman_mse’, random_state=1, oob_score=False, n_jobs=8, verbose=1)
regressor.fit(X,y)

The hyper parameters will be the same and I have commented out the extra trees regressor but you might consider trying it too.

I don’t know if that helps but it represents a clarification of my above post and reflects what is working for me now.

Jim

@Jim

one question for: regressor.fit(X_train,y_train)
what would be the time for the length of X_train and y_train?
1 Year, 3 Years, or shorter 3 Month?

As well for the predict: regressor.predict(X_test)
what would be the appropriate time length for X_test?
Lets say using a 5 day excess return 5 days into the future?
5 days for length of X_test?

I tried with the suggest setting:

regressor = ExtraTreesRegressor( bootstrap = bootstrap, n_estimators=n_estimators, min_samples_leaf=min_sample_leaf, max_features= max_features, criterion=‘friedman_mse’, random_state=1, oob_score=False, n_jobs=8, verbose=1)

min_samples_leaf = 1000
max_features = ‘sqrt’
n_estimators = 2000
bootstrap = True

and

train_period_length=250
test_period_length=20
which means, I train 250 days, predict 5 days, store the predicted values as the new factor and move 5 days forward. than again train 250days…
At the end I select the stocks based on the predicted values (ranking, select top 20) for around 8 years and calculate the returns.

How much can one expect as improvement from a original factor invest strategy using the above method?

For me, at the moment, I get a much worse result than the original factor invest strategy with the above settings.

I really don’t understand what I’m doing wrong.

Best
Carsten

Edit: I had ChatGPT rewrite what I did as people have claimed I am difficult to understand AND MY FACTS ABOUT EXTRA TRESS REGRESSORS HAVE BEEN CHECKED by ChatGPT now. Honestly, I see no improvement but also I guess I already knew what I was trying to say. Still, I am left thinking not everyone will understand ML/AI no matter how it is presented.

Anyway, the style (or even the length) is not mine and meant to be informative. Added because Carsten asked, because I have actually done this myself and now run a live system that included Extra Trees in the cross-validation and because P123 is near release of an AI/ML method making this a legitimate topic for the forum I would think. I am not using an Extra Trees Regressor in a live system now but it did well and I am actively looking at a modification now (did some work on it yesterday). Extra Trees regressors can work for sure.

Maybe @marco and @Riki37 can add to this. I understand that have been working hard on AI/ML—spending a lot time and working with a professional AI/ML person (with a method near release). They could add a different perspective, clarify my method or call BS on it at any time. I would certainly welcome it at the time of the AI/ML release if not before. I am not trying to hijack what they plan to do here and the specifics of the P123 implementation would be helpful at the time of release. And even now (before the release) as far as I am concerned.

But this is the best answer I can give for anyone serious about this with the idea that real money is at stake. With the idea that some of this has actually mattered for me. Also, Carsten is an advanced programmer who can implement all of this if he finds it useful.

Hi Carsten,

I hope this message finds you well. I wanted to follow up on our previous discussions and share some insights that might be beneficial for the entire team.

Firstly, I’m assuming that since our last email, you’ve started utilizing excess returns in your analyses. I firmly believe that no other target will suffice, regardless of any additional changes you might implement.

It’s crucial to reconsider the use of the Extra Trees Regressor at this stage. This algorithm, known for its random selection of splits and factors, can be sensitive to the quality of the inputs. Its advantage lies in preventing overfitting and enhancing computational speed since it doesn’t require finding the optimal split. This randomness helps in avoiding overfitting to specific splits, which is beneficial for both overfitting issues and runtime efficiency.

However, the downside is significant. If you’re using low-quality factors, they will have a more pronounced influence in the Extra Trees Regressor compared to other models like Random Forest or Boosting algorithms.

Take, for instance, the factor AvgRec. It’s a core component of our ranking systems and intuitively seems like a good choice. But, according to insights from Zacks, who have extensively analyzed analyst recommendations, it doesn’t hold up effectively. Regardless of any preconceived notions, my analysis using the P123 platform strongly suggests its ineffectiveness. Here’s a screenshot illustrating my point:

In light of this, if you plan to incorporate such factors, I’d recommend opting for a Random Forest model. This model selectively focuses on the best features and splits at each stage, thereby minimizing the impact of less relevant or noisy factors.

Additionally, I urge you to explore feature importances and reiterate the value of using recursive feature selection, especially if you have access to computational resources that can handle the process efficiently. Consider utilizing platforms like AWS or Colab if your current setup is limiting.

Regarding your training and testing methodology outlined in your post:

I must admit, I’ve never tried such an approach, and your post doesn’t particularly sway me towards it. In my practice with k-fold cross-validation and an embargo period, I’ve consistently used 15 years for training and 3 years for testing, with a 3-year embargo period. This is a non-negotiable standard for me.

For time-series validation, my method involves starting with a 10-year training period (e.g., 2000-2009) and testing it on the subsequent year (2010 in this case). Each subsequent year, I expand the training data by one year, ensuring a minimum of 10 years of data for training and maximizing the amount of training data at each step in the time-series cross-validation.

I have reservations about constantly rolling the training period to the last 10 years, as it doesn’t seem as effective. My hypothesis is that the anomalous underperformance around 2018 could negatively impact your model, potentially lasting until a few years post-2027 if my calculations are correct. Such anomalies, which do not persist, should ideally be diluted by a comprehensive set of training data.

In conclusion, I strongly advocate for the use of recursive feature elimination, particularly if you’re not being highly selective with your features. Moreover, leverage as much training data as feasible, regardless of the cross-validation method employed. Consistency in advocating for recursive feature selection remains a cornerstone of my approach.

Feature ranking with recursive feature elimination (RFE)

Looking forward to your thoughts.

Best regards,
Jim

@Jrinne

big thanks for the great and lengthy explanation!

I ran today several times Extra Trees Regressor with you proposed setting.
The factor strategy used around 50 factors which I all checked based on their Ranks, none is looking like the picture above, all have a clear trend. The ones which did not had a clear trend I deleted. All trend same direction.
Universe is S&P500.
Now running 10 years training and one year prediction.
As Target I use a 5day excess return 5 days into the future.

The strategy without ML had around 16% CAGR and a Sharpe Ratio around 0.7.

Using the predicted value to select the stock (always top 20) I get around -4% CAGR.

The only part im looking into is, the pre treatment of data.
I did not us any z-score, min/max or other “data cleaning” so far.

The expected result is so far off, there must be a mistake somewhere.
Either I need better “data cleaning” or a bug in the code…

Actually im running since some hours RFE (should be ready by tomorrow).
should work like this if someone is interested:

  # define the model        
  regressor = RandomForestRegressor(n_estimators=n_estimators, min_samples_leaf=min_samples_leaf, max_features= max_features, criterion='friedman_mse', random_state=1, oob_score=False, n_jobs=-1, verbose=1)

# Iterate over each split
for i, (train_index, test_index) in enumerate(cv.split(data)):
    train = data.iloc[train_index]
    test = data.iloc[test_index]

    # Define train and test sets
    X_train = train[feature]
    y_train = train[target]
    X_test = test[feature]
    y_test = test[target]

    # Fit the Model and Rank Features using RFE
    selector = RFE(regressor, n_features_to_select=20, step=5)
    selector.fit(X_train, y_train)

    # Selected features after RFE
    selected_features = selector.support_
    print(i,"Selected Features:", selected_features)

    # Final Model Training
    regressor.fit(X_train.iloc[:, selected_features], y_train)

    # Evaluate the model
    y_pred = pd.Series(regressor.predict(X_test.iloc[:, selected_features]), index=test.index)

In this case it reduces to the best 20 factors in steps of 5 and than goes from there with a standard RandomForestRegressor.

But I guess I have somewhere a bug in my whole setup…

many thanks
Carsten