A rough patch or a broken trading system

All,

For you many old timers of P123, how you decide when your trading system underperforms for a period if it is simply passing market conditions or that your system no longer works?

I recently was able to implement Meb Faber’s Global Tactical Allocation System after reading about it in one of his papers, using 13 different ETFs, coupled with momentum in what he called the Aggressive 3 and Aggressive 6 versions. I ran the AGG 3 version for the period 01/02/2002 … 12/31/2022 and got satisfactory (not stupendous) results (~ 2% better CAGR than SPY). I decided to see what the performance would be for the period 01/02/2009 … 12/31/2022. I was shocked to see CAGR of 6.25%, well below SPY. I shuddered to think what may have happened after I had my belief in the buy-and-hope and diversify gospel broken in 2008, and I had chosen the AGG 3 method to invest. (I probably would have quit after 2 years of underperformance.)

So back to you folks – when you experience under-performance in your trading system do you decide that it is broken instead of simply hitting a rough patch?

Cary

Cary,

SInce I try to play the absolute performance game rather than relative performance (relative to SPY for instance). I will cut my allocation to any particular strategy by 50% if it lost money 2 months in a row and abandon it completely if it has 3 simultanous monthly losses no matter how good the in-sample backtested performance. Another way that I use is to look at the Sharpe ratio for the last 6 months, if it is negative, I will also stop using that strategy.

This is based on the recommendation from a financial spread betting handbook. I think there are better strategies to allocate my capital if the above happens.

Regards
James

1-2 years should be your time horizon if your conviction in your system is high. If not it’s probably best to follow your strategy on paper accounts, or with a small portion of the capital. The rest of the capital in a pre-built model by us, or a Designer Model with a long track record.

Underperformance is a tough pill to swallow. You are paying for a P123 membership, placing orders monthly or weekly, all the while under performing a simple buy & hold of the SPY. What could be worse! BTW, this is a major problem for us as well since a lot of users give up after just 3-6 months of underperformance and don’t look back.

To prove my point I’ll just leave you with a real world example. This person’s identity will be revealed soon! For now I’ll just call him Joe.

Joe started using P123 with around $1M with a strategy he developed on April 2019. After around 10 months of underperforming the SPY, he added an extra $250K.

Naturally, right after doubling down, a crash always happens (covid in this case) and Joe’s account hit an all time low of $800K, for a $450K loss. The SPY also crashed of course, but by April of 2020 returned to around 0%, and Joe’s account around -10%. This is what it looked like:

So, after a crazy year, Joe’s account is close to where he started. This is his nest egg, and he’s close to retirement. Most would cut their losses, cancel P123, and pull the money out. Who would have kept at it?

Well Joe did. He kept his P123 membership, kept trading systematically, and this is his account today. It’s sitting around $7.3M vs a buy-and-hold of the SPY of around $1.6M.

Life-changing as he calls it, but it’s not something most people can stomach. I would have not been able to do it. I’m so grateful he did as it inspired me to believe in what we’re doing.

Thanks “Joe”!

Nice! The annualized return is about 70%, right? I have so many question to ask!

“Joe” just contacted me. Turns out I didn’t know the full story. And I used the wrong charts (they have been updated).

He started with P123 Oct 2015 with $160K and grew it to $1M by 2019, then added $300K

So the underperformance of 2019 was easier to stomach. Still, losing $450K and going a whole year underperforming still requires strong conviction.

Perhaps the real story is of his starting capital being just $160K less than 10 years ago.

Cheers

If I recall properly I think Joe told his story here on the forum a few years back.

Cary,

I rebalance on a daily basis instead of doing it on a weekly or monthly basis. If you perform weekly or monthly rebalancing, I agree with Marco that you need to give at least one year to see if the strategy is working out of sample or not before pulling the plug.

@marco : Even when a particular strategy of mine does not work out and sustain 3 consecutive monthly losses, I do not mean we should leave P123 and never look back. Rather, I think we should continue to research/built new strategies due to the changing and new market condition and P123 is probably one of the best place online to built new strateiges for different asset classes with ETFs in my opinion.

Regards
James

So the posted equity curve is based on an ETF strategy?

This is a great discussion.

But keep in mind that stock picking is different than market timing (Meb Faber’s system).

Market timing can reduce risk at the expense of underperformance during bull markets; sometimes for a decade or more.

With stock picking, if you are really really good and have small capital you can outperform most of the time.

Joe revealed…

The landing page for the e-book is here

You can direct-download his e-book here
https://www.portfolio123.com/e-book/how-i-made-a-million-bucks-with-portfolio123.pdf

Dear all,

Here is the 5 year performance comparison of Joe* vs Citadel Wellington (after fees) vs Medallion (after fees).

Regards
James

2018 2019 2020 2021 2022 3 yr annualized net return 5 yr annualized net return
Joe 4.48% 10.95% 87.53% 59.19% -9.20% 39.43% 25.73%
Citadel Wellington 9.03% 19.32% 24.51% 26.58% 38.22% 29.63% 23.02%
Medallion - Renaissance Technologies 40.00% 39.00% 76.00% 48.00% 19.00% 46% 43%
S&P 500 -4.40% 31.00% 18.40% 28.70% -18.10% 7.66% 9.34%
  • based on the figures below provided by Joe in the forum

If possible, please add beta and sharpe ratio for the comparison, along with the total $ of profit. If those aren’t all available, maybe max drawdown instead. I think that would help make the comparison better.

Korr : Due to the lack of data (standard deviation to calculate Sharpe). It is only possible to compare the net return but have added Medallion. Citadel Wellington 5 yr Sharpe is 2.48. Joe 7 yr Sharpe is 1.33.

It should be noted that Medallion (for Renaissance Technologies employees only) performance is very different from the 3 external funds (which trade medium/long term) and are all underperforming the market on a 3 year and 5 year basis. It seems that they have kept the secret sauce in-house for Medallion only,

2018 2019 2020 2021 2022 3 yr annualized net return 5 yr annualized net return
Medallion - Renaissance Technologies 40.00% 39.00% 76.00% 48.00% 19.00% 46% 43%
Renaissance Institutional Equities Fund 8.50% 14.14% -19.43% 20.45% 5.25% 0.71% 4.81%
Renaissance Institutional Diversified Alpha 3.24% 4.65% -31.58% 14.72% 4.77% -6.31% -2.34%
Renaissance Institutional Diversified Global Equities 10.30% 6.67% -31.24% 10.45% 1.76% -8.23% -1.88%
S&P 500 -4.40% 31.00% 18.40% 28.70% -18.10% 7.66% 9.34%
  • Both RIDA and RIDGE are market neutral hedge funds

Here are the performance for 3 of Citadel’s external hedge funds.

2018 2019 2020 2021 2022 3 yr annualized net return 5 yr annualized net return
Citadel Wellington 9.03% 19.32% 24.51% 26.58% 38.22% 29.63% 23.02%
Citadel Tactical 8.88% 20.30% 20.24% 21.55% 25.75% 22.49% 19.21%
Citadel Global Fixed Income 6.74% 5.49% 17.53% 12.97% 33.15% 20.92% 14.76%
S&P 500 -4.40% 31.00% 18.40% 28.70% -18.10% 7.66% 9.34%

This is great. Thank you very much.

I think those are all net of fees for the funds, right? So like, medallion’s returns before investor feees are almost 2x that rate. Citadel has a passthrough rate and then something like 2% mgmt fee and 20% profits. Perhaps close to 2x as well?

Unbelievable if that’s close to accurate.

That ain’t no average Joe.

Korr,

Yes, you are right. All the returns stated for the funds are after fees.

Medallion charge a 5% management fee and 44% performance fee. I just checked the hedge fund database and Renaissance Technologies has lowered their fees. (probably due to poor return) RIEF currently charges 0.35% management fee and 10% performance fee while RIDA and RIDGE charge 1% management fee and 10% performance fee.

Citadel is 2% and 20% performance fee + passthrough for IT and personnel expenses (same as most multi-strategy funds) which should be another 1-2%.

Regards
James

Impressive performance from Joe. It’s kind of unfair to compare Joe to armies of PMs/quants at the top funds, but Joe probably did better than most of the actively-managed funds on the street.

All,

Thank you for your comments. Much to consider. Thanks especially to “Joe” and others like him who show that it can be done, despite the difficulty,

As for Meb Faber’s GTAA 13 Aggressive 3 and 6 versions, I don’t think of them as market timing. After all, the universe of 13 investable assets are ETFs representing different classes, some US based, some foreign based, some representing stocks, others commodities, etc. (See “A Quantitative Approach to Tactical Asset Allocation”, SSRN-id962461, https://mebfaber.com/wp-content/uploads/2016/05/SSRN-id962461.pdf ). For some of the strategies outlined, they are buy-and-hope and rebalance. Others, though, such as the Aggressive 3 and Aggressive 6, attempts to select the best performing 3 (6) ETFs using a momentum only strategy, namely as ranked by the average of 1, 3, 6, and 12 month momentums (p. 50). Here is a snippet of “Figure 20: Buy & Hold vs. Various GTAA Allocations, 1973-2012”, p. 52:
image

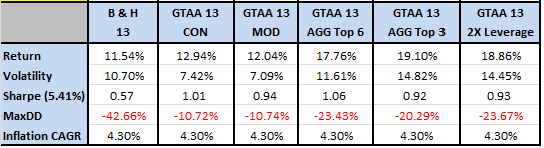
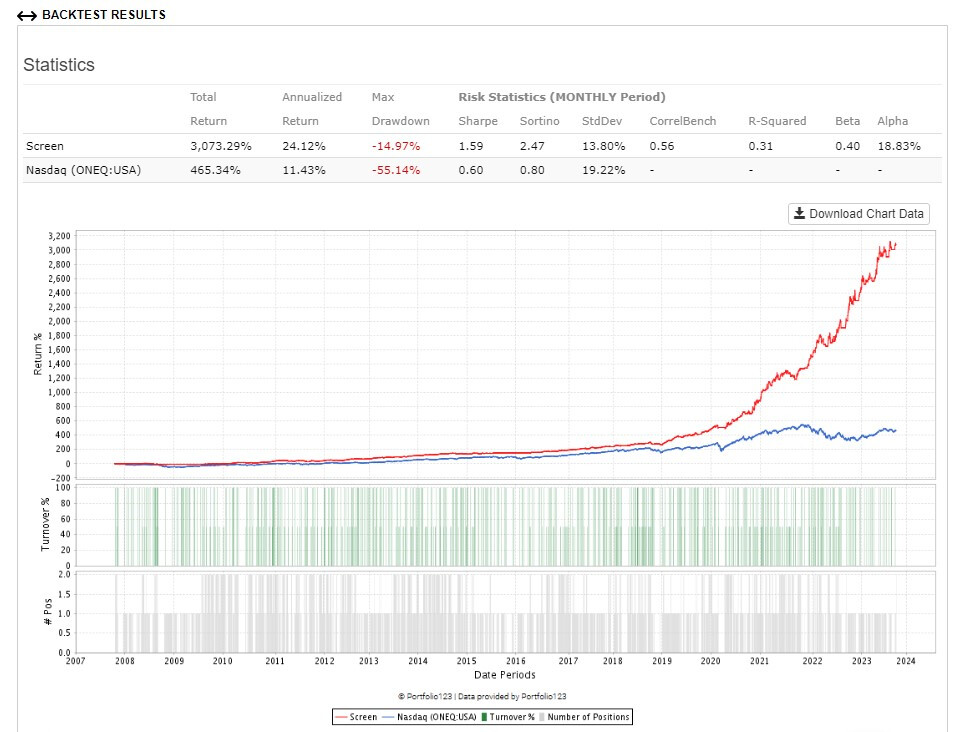
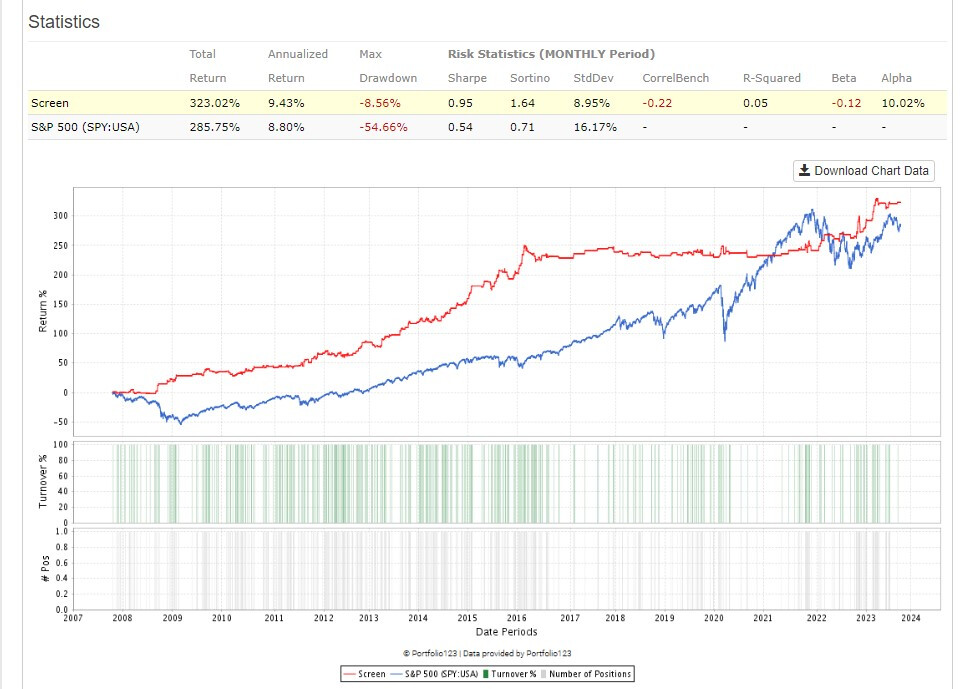
So through 2012, the total performance (CAGR) of GTAA 13 AGG 6 and AGG 3 were far better than S&P 500. So I tried to duplicate the results in P123. Because of my membership restricts me to going back 20 years from my join date (April 2022), then I could measure the performance over that period. Here is what I got for AGG 3 for 01/02/2002 … 12/31/2008:
CAGR: 11.07%, Annual turnover: 286.20%, Max drawdown: -25.33%, Sharpe: 0.59.

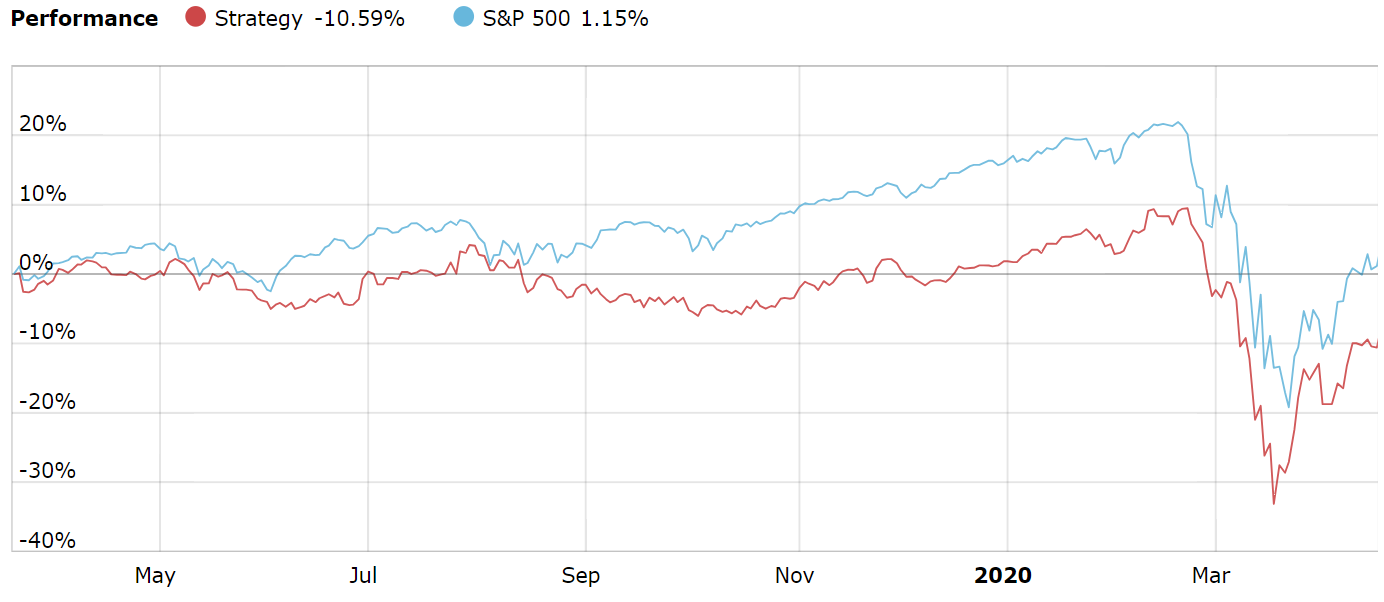
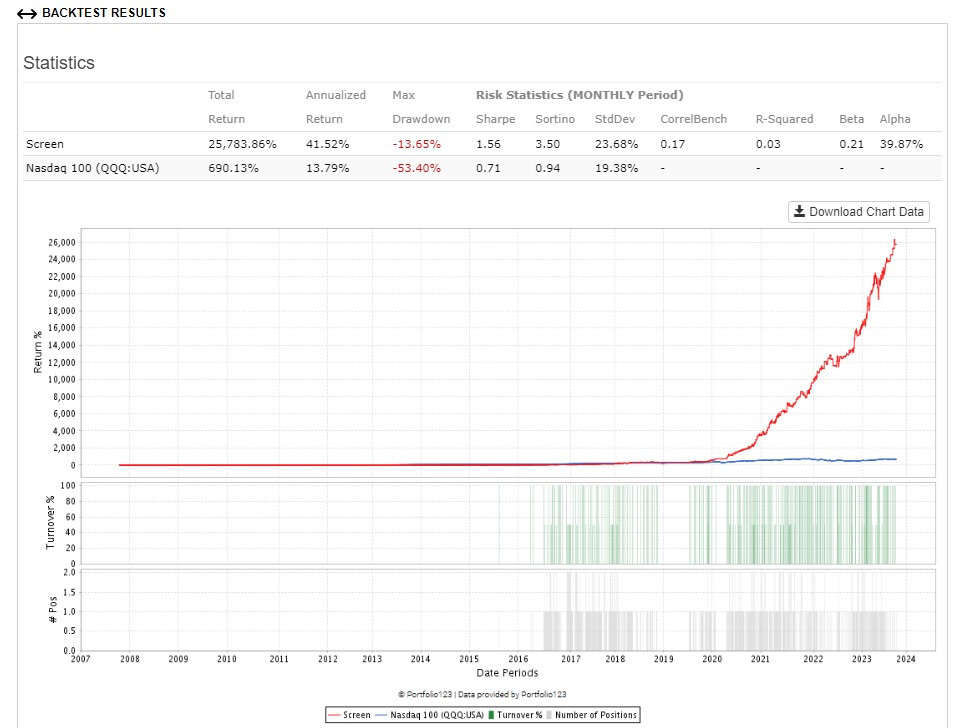
Not like the performance in Figure 20 of Meb Faber’s Figure 20, but still better than the S&P 500. But I then ran the AGG 3 system from 01/02/2009 … 12/31/2002. Here is what I got:
CAGR: 5.29%, Annual turnover: 426.19%, Max drawdown: -43.11%, 0.46.
The performance of the strategy was better than the S&P 500 until about 01/02/2015, and then it started downtrending, losing money.

Prior to coming to P123 I signed up with AllocateSmartly.com, a system that offers many different ETF strategies, from different forms of buy-and-hope such as the Permanent Portfolio, to different tactical asset allocation strategies. The first 2 strategies I signed up for was the Adaptive Asset Allocation (see Adaptive Asset Allocation - Allocate Smartly ) and the Vigilant Asset Allocation (see Vigilant Asset Allocation from Dr. Wouter Keller and JW Keuning - Allocate Smartly ). At the time they were among the best performing strategies. I followed them for 2 years, and both years they badly trailed the S&P 500.

I am beginning to wonder if there is any ETF strategy that beats buy-and-hope. Looking at the designer models on P123 for those strategies that have been in existence for 5 years or more, almost all of them have terrible 3-year and 5-year returns. So perhaps investing in ETFs is not a promising approach.

Comments?

Cary

If you call them tactical allocation market timing or not is semantics. That’s not the point.

I have spent years of research on many tactical allocation systems. Basically, most of them use some combination of momentum, mean reversion, and/or economic indicators to choose asset allocations. No indicator is close to 100% accurate, which in practice means that years (perhaps a decade or more) of under-performance are to be expected. Furthermore, since market crashes don’t take place every day, there are not a great deal of data points to go by, which reduces the statistical probability of strategies working well.

Therefore, they have the same weaknesses as market timing. Limited data, and far less than 100% accuracy.

That said, they can be very useful for risk reduction–but only if you are okay with the knowledge that you might miss out sometimes.

Cary,

I have been getting great out-of-sample results from a Combined ETF strategy (based on 3 underlying sub-ETF systems below.) They has all been cross validated .

I don’t want to give away too much of the secret sauce but these are the basic descriptions. First, divide the whole period into risk-on/risk-off.

This sub-system 1 is risk-on based on XLK and XLE.

This sub-system 2 is also risk-on and based on a pair of leveraged and inverse ETFs trading at 50% weight.

This is the risk-off sub-system with GLD, IEF and EDV

Finally, this is the combination of all three risk-on/risk-off sub systems.

Using P123 to build ETF strategies work out-of sample.

Regards
James