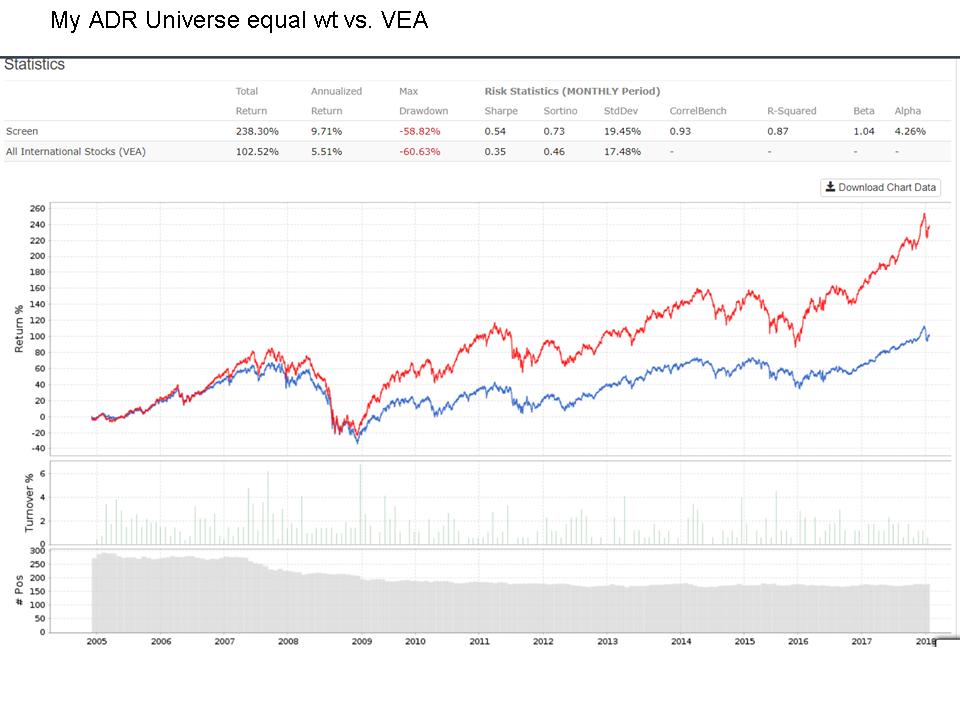
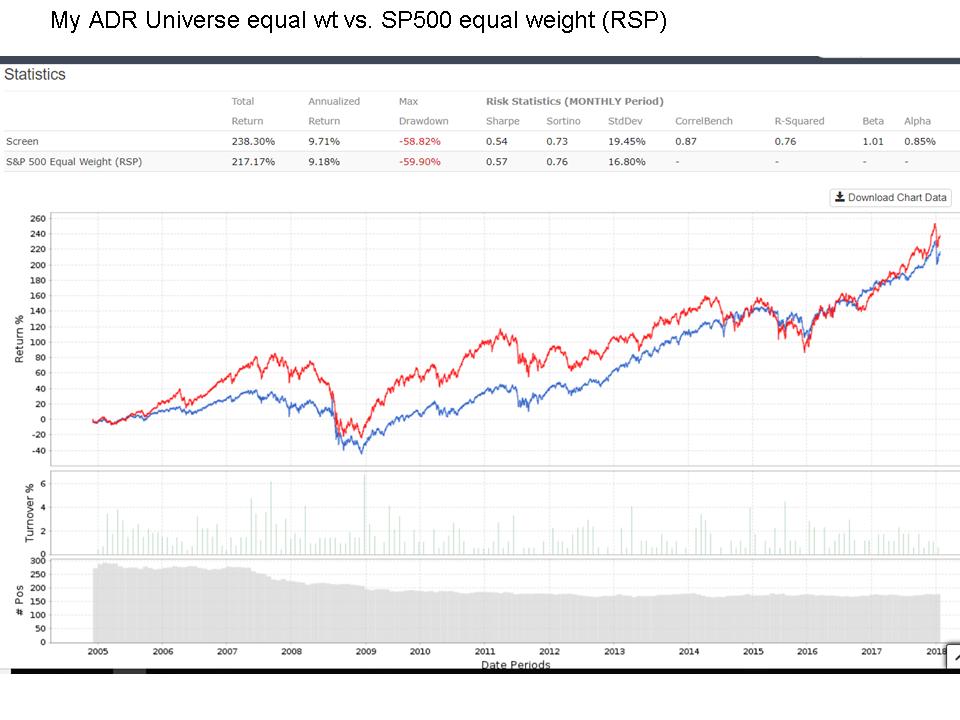
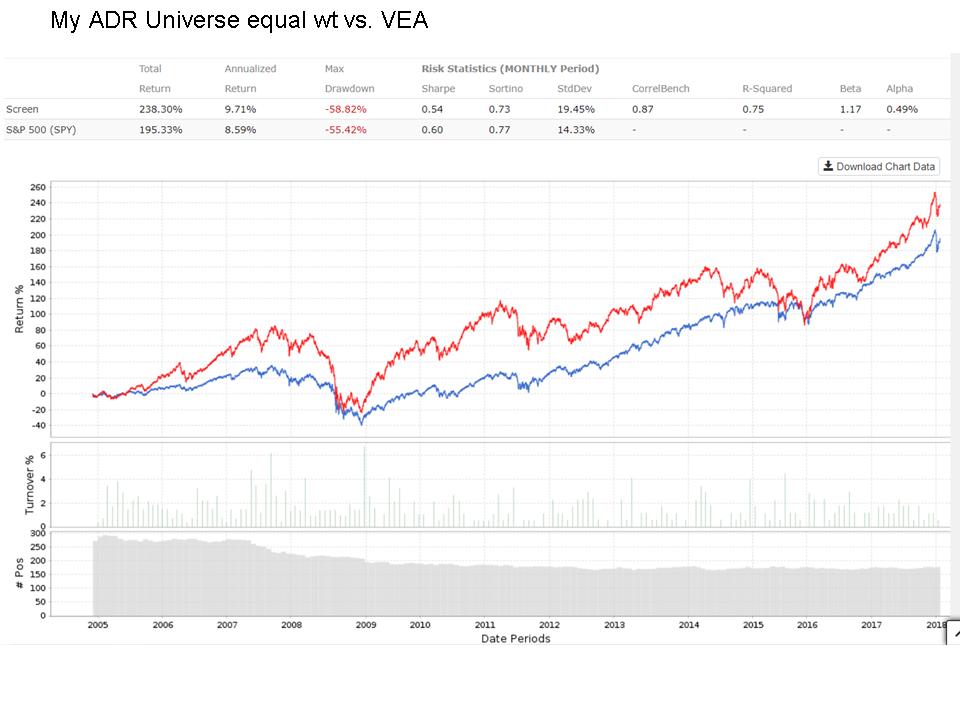
Hi all, I’ve been looking at ADRs recently, and was just running some numbers on the universe I’m using (rules below), and I’m wondering if the ADR universe should serve as a proxy for international stocks. It seems the universe of ADRs might perform more closely to the US market than the International market. On the other hand, if the ADR universe does serve as a good proxy for international stocks it seems to easily outperform the VEA ETF, and perform more inline w/ SPY or RSP - although visually movements and trends in ADRs do do seem to visually correlate more VEA. (Universe includes ADR stocks only, not foreign domiciled stocks that are listed on the US exchanges).
So I guess I’m wondering if there’s a conclusion I should draw from this:
- Might ADRs in the most generic sense be a better way to diversify internationally than buying international ETFs.
- Is it more likely ADRs will perform more similarly to the SP500, and not really serve as much diversifier?
- I guess underlying this is the question: What do you think it the appropriate benchmark to compare ADRs to?
- Underlying thought: Should i convert some of my international ETF exposure to an ADR model?
I also pick up some international exposure with my other models too - but just thinking about ADRs currently. The ADR data can be pretty spotty so I think it might benefit from its own model, but I haven’t looked at ADR and listed but foreign domiciled stocks in combination yet. Below are some charts of ADR vs. VEA, vs. RSP, and vs SPY. (edot last picture is vs. SPY, not VEA as the text in image shows - sorry didn’t notice til I’d already uploaded)
ADR Universe Rules I’m using:
Universe($ADR)=True and Universe(NOOTC) and Universe(MasterLP)=False
Sector != FINANCIAL and Sector!= REALESTATE //performs 9.27% annual vs. 9.71% if I allow Financials/Real Estate, but general thoughts on above are consistent
MedianDailyTot(63)> (100000* $SP_Ratio2016) //liquidity requirement expands or contracts based on level of SP500
IssueChange(5) = 0
DaysFromMergerAnn = NA
Country(“CHN,RUS”) = False //results don’t change meaningfully if I include RUS,CHN
You should be comparing your ADR universe to an equal weight international stock index.
I think your universe rules are excluding too many ADRs. First of all, a huge number of ADRs are not traded on the major exchanges, including many of the very biggest ones–Nestle, Naspers, Roche, Hennessy, L’Oreal, Siemens, Allianz, BNP Paribas, etc. Second, DailyTot, I believe, measures the volume of the ADR itself (on US exchanges) but not its total trade internationally, and includes some really weird numbers (the MedianDailyTot(63) of Naspers, Heineken, Lukoil, and Imperial Brands, for instance, is 0).
Thanks for the insight Yuval. I’ll look to adjust the constraints maybe to account for mktcap or similar
Do you have a view on whether the type of companies that have ADRs provide similar exposure as diversified international ETF? It concerns me that the ADR universe seems to have returns more similar to SP500 than VEA.
edit: Yuval, thanks for the comments. I made the changes. I didn’t realize the missing volume data on some of the OTC ADRs.
Top ranking stocks now include 3 OTC ADRs in the top 10 (ELUXY, NGLOY, ICAGY) and one of them (NGLOY) is $31B MktCap and has no volume data. I added an “or” constraint for MedianDailyTot to also consider MktCap.
Top 10 in current model are: GOL, DCM, TEO, RIO, ELUXY, NGLOY, ICAGY, AVDL, VALE, AUO
VEA is cap weighted; it includes a LOT of Canadian stocks, which are excluded from the ADR universe; it includes no Latin American, Russian, Chinese, South African, or Indian stocks, which ARE in the ADR universe; and it includes some huge companies that are not included in “All Fundamentals,” like Samsung (SSNHZ). The “All Fundamentals” universe only includes about half of the ADRs in the “All Stocks” universe.
So to approximate VEA, I would do the following. Choose the “All Stocks” universe. Use the Country command and list the major countries in Europe and the Far East, as well as Israel, Australia, and New Zealand. Don’t use the $ADR universe because you’ll exclude Canadian companies. Then choose the top 100 or so stocks by market cap using the FRank command. VEA includes almost 4000 stocks, but the huge majority have negligible weights. Weight these by market cap in a sim and you should get a curve quite similar to VEA.
The “All Stocks” universe does actually include almost all of the companies in the top twenty or thirty holdings of VEA, if I’m not mistaken, and maybe even the top 100. So it is a really good representation of what’s out there.