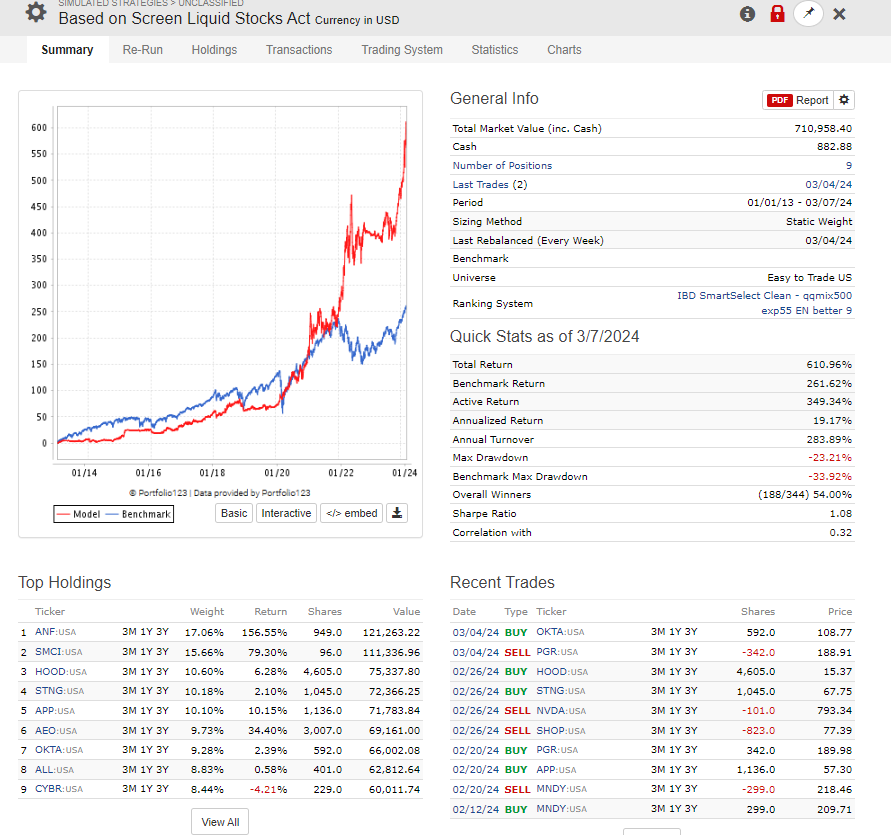
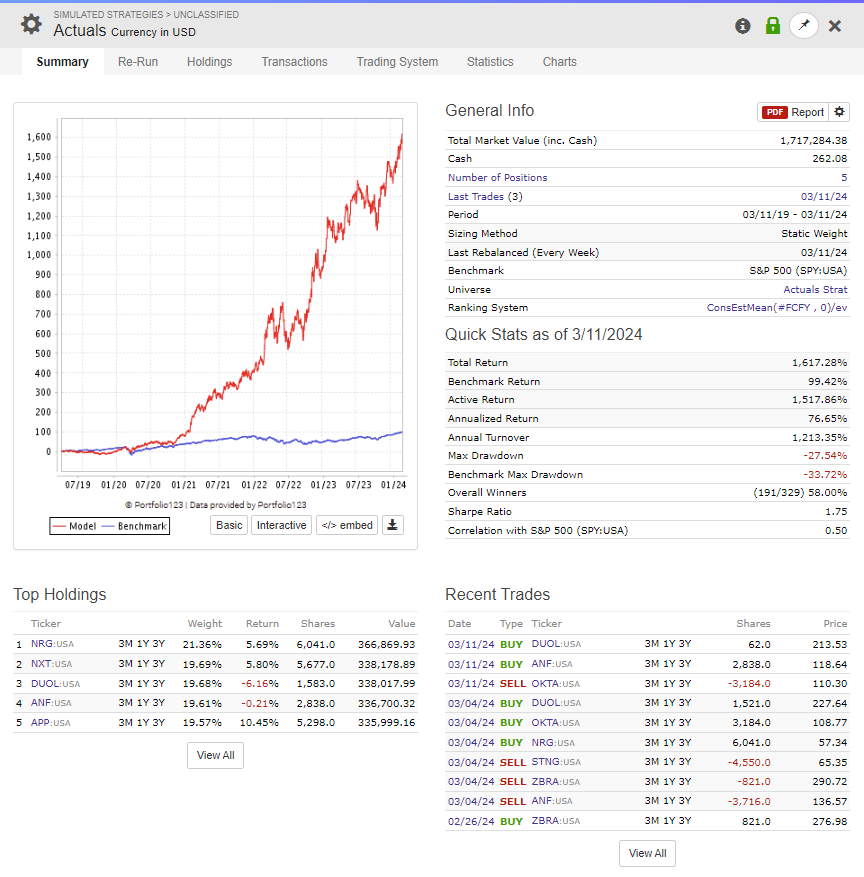
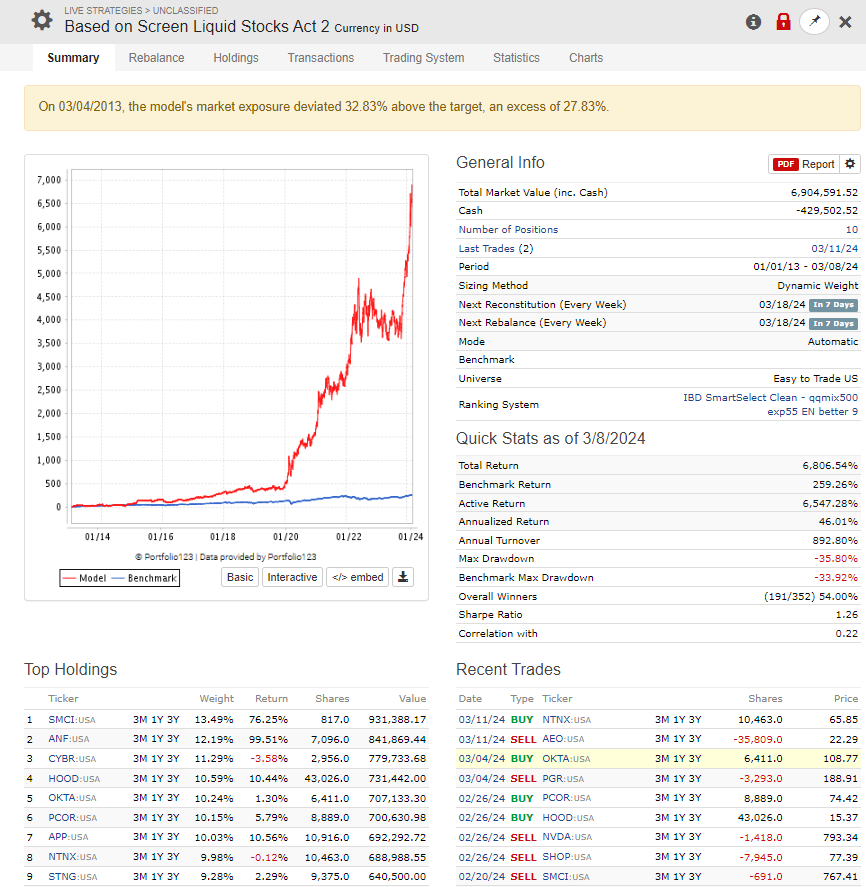
Played around with actuals in combination with earnings estimates Rate of change.
Looks a bit hefty to me (all liquidt stocks, mostly mid to big caps).
Please coment. TY
Played around with actuals in combination with earnings estimates Rate of change.
Looks a bit hefty to me (all liquidt stocks, mostly mid to big caps).
Please coment. TY
Those are highly liquid stocks!
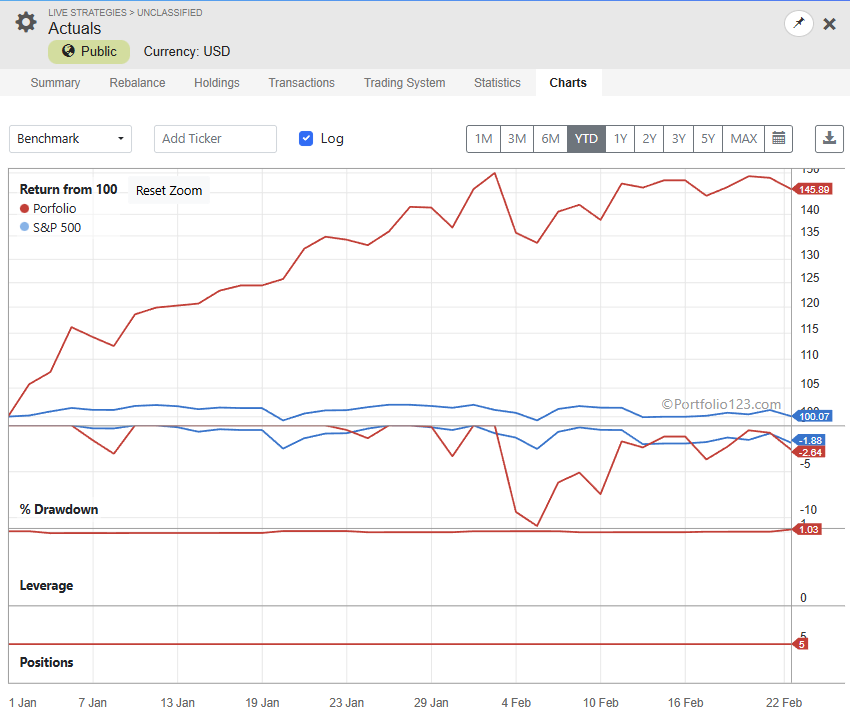
Interesting. Def worth keeping an eye on ![]()
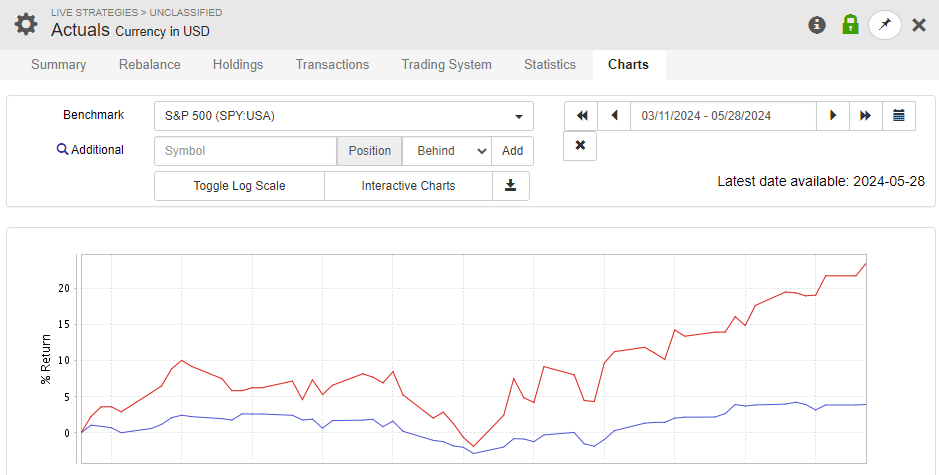
@yuvaltaylor Check out 2020 - Present
This one is on highy liquid stocks + variable slippage. Just not used to strats that are higher cap and print that kind of backtest.
So based on your answer I understand that actuals are PIT!
Great data add!
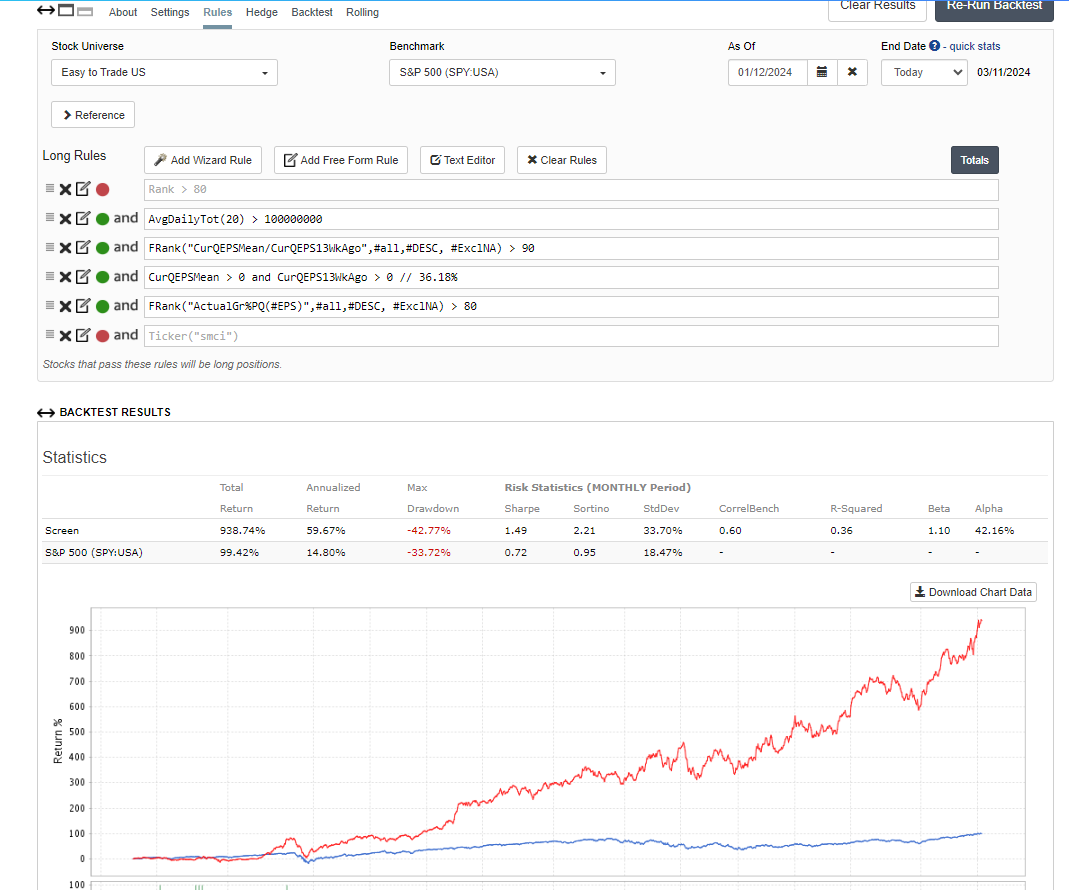
Interesting sim. I had trouble getting similar results until I realized that Force Positions into Universe=False was needed. Setting that to true trashes the equity curve. I suspect the Universe changes a lot. I need to look at that.
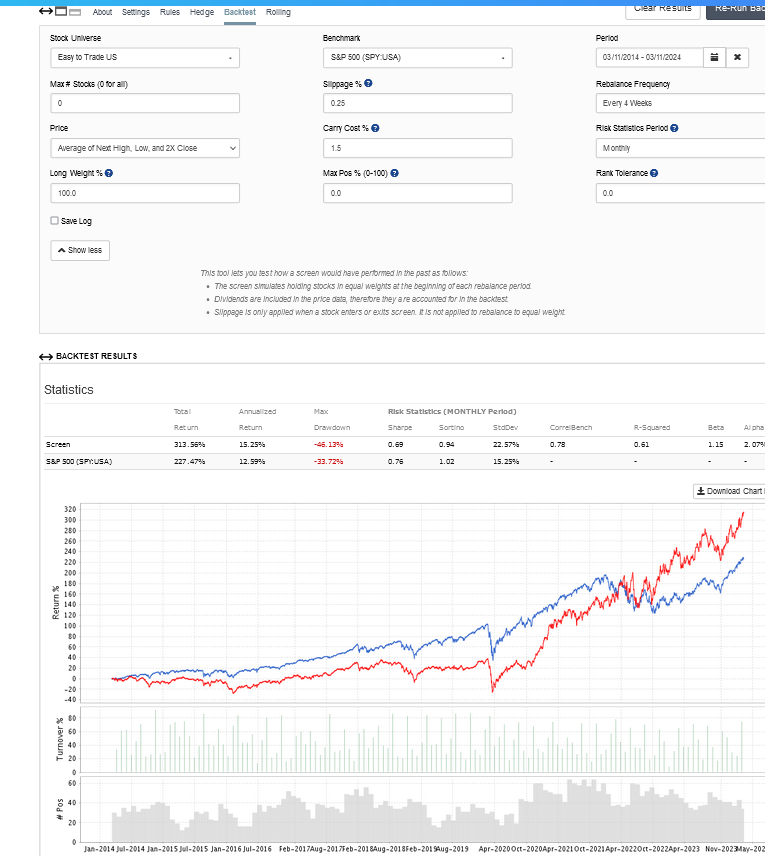
The outperformance AlgoMan puts a finger on happened between October 2020 and February 2023. Before and after those dates, the performance was congruent with that of the S&P 500. If you substitute for the rule frank("ActualGr%PQ(#EPS)",#all,#DESC,#ExclNA)>80 the rule frank("(EPSActual(0,Qtr)-EPSActual(1,QTR))/EPSActual(1,Qtr)",#all,#DESC,#ExclNA)>80 you get a very similar result. So I don't think, as JudgeTrade implied, that there's any lookahead bias here.
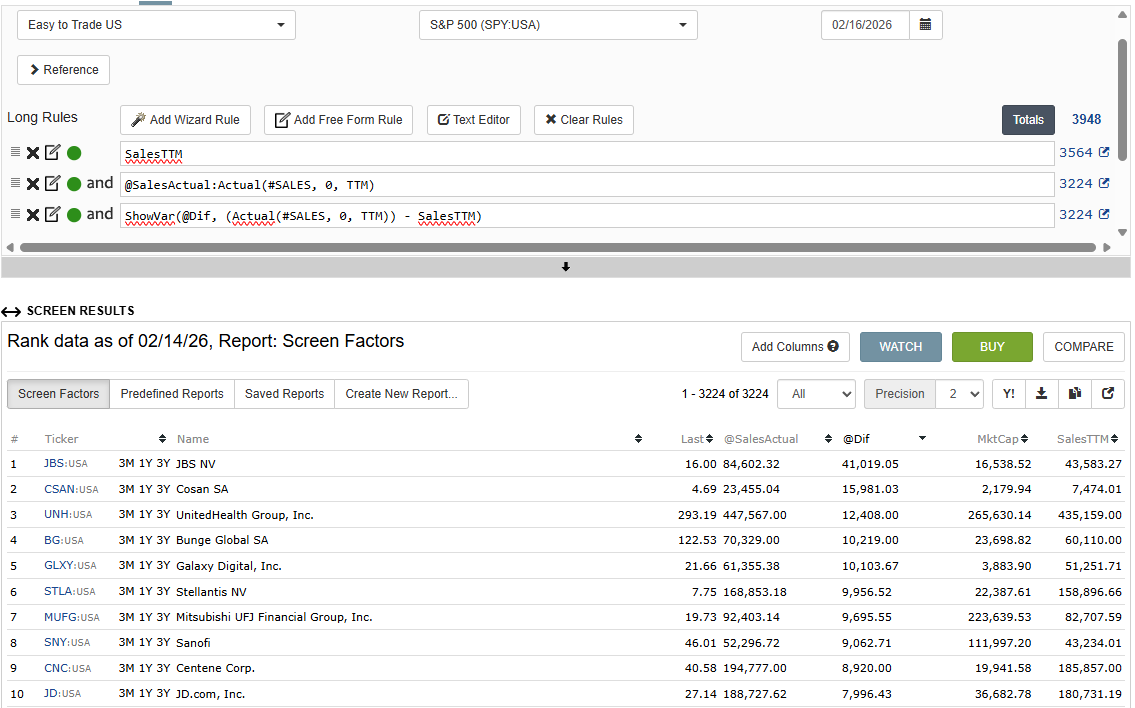
I took a quick look at the differences between Actuals and Fundamentals and noticed some of the biggest discrepancies are mostly in international companies. Has anyone else seen this? Any thoughts on the cause (other than GAAP vs. IFRS)?
Well, the latest QTRs for BG, UNH and GLXY are marked preliminary at Factset. Setting 'PIT Method - Prelim' = Use, aligns the Actuals and Sales.
CNC - no problem found.
JBS - looks like data for two QTRs is missing. SalesTTM is about half of what it should be.
SNY is shown reporting semi-annually. I need to dig into this some more. And the remainder need more work, too. I'll investigate as time permits.
Actuals do not follow GAAP. That is another difference that is not GAAP vs IFRS. And of course as you mentioned ADRs use GAAP for financials so can be an instant difference if local “releases/Actuals” are local accounting. Foreign exchange is a big one too since management might opt to exclude FX losses as extraordinary. Interested to hear more!
What are some best practices to avoid “empty” TTM quarters in a TTM factor? JBS is a 17B company so seems like even sticking to larger caps is not enough. I am glad I check all my stocks one by one. Should a missing quarter not ideally result in NA? Is an eval and set of is NA functions required for all ttm functions?
@acr2017 Have you considered using an NA handling choice in your TTM factor for the comparison?
Not yet. I have been playing around with Claude and not returned to this topic yet.
@WalterW what can be done to avoid these missing quarters going into TTM values?
Not much. The values are not missing; they are 0. I haven't looked directly at the reported statements, so I don't know where the values are coming from.