Backtest Consistency: Different Results from Same Test

Hi everyone,

I have some questions about backtest consistency.

I'm testing the same ranking factors (both individually and together) using the same time period in the past, but when I run the simulation on different days, I sometimes get very different results.

Some factors give stable results every time, but others change a lot — sometimes with big differences in performance.

To simplify and avoid dragging you into my custom formulas, I ran a clean test using the public strategy “Small Cap Focus” using this date range:
May 21, 2020 – June 9, 2025


I know some data can be updated later, but it feels strange to see such big changes in results — especially for data from 5 years ago.

Also, I noticed that some single factors can cause huge changes in returns if you just rerun the backtest on a different day — even on the same period in the past.

Is this normal behavior?
How do you deal with consistency when testing strategies?
Do you screen factors for historical stability, and how?

Thanks for your help — I’d love to hear how others deal with this!

Hi 'Babeshkin' :),

I’m afraid the only people who can truly answer this question are the backend developers at Portfolio123. But let me chip in anyway. I checked your systems and, from what I can tell, they are identical. If that’s the case, the issue must lie with FactSet’s data not being fully point-in-time (PIT).

As a quick check, I tried downloading the transactions from both systems to see what was happening.

The first discrepancy appears early in the simulation, on 2020-08-03. In your first simulation, VMD is sold because its rank dropped to 95.72. In the second simulation, the same thing happens, but VMD’s rank is 95.74. This suggests that either a NaN in the universe turned into a non-NaN value or a company entered the universe after a data update.

While this difference is minor at first, over time these—and other small—discrepancies can sometimes alter a simulation’s results by a noticeable margin.

As users, the best step is to build systems that pass common robustness checks so that, when FactSet updates its data, the strategy keeps working. Use many factors rooted in financially and commercially sound hypotheses, and test them on multiple universes, across different periods, and preferably in several geographies. Probably not the answer you were looking for though.

Another option is to license Compustat through Portfolio123. It’s a significant investment—about $30 k per year—but well worth it if you intend to work professionally. Compustat, together with CRSP, is regarded by many as the gold standard for PIT data. Having a second data source is a pretty huge boost in the robustness of your strategies. Again, probably also not the answer you were looking for.

Nevertheless, in case this indeed is a FactSet 'issue', I agree that this is a valid—and somewhat unsettling—pain point.

Best,

Victor

2 Likes

Noticed the same. Raises questions about reliability of data.

I've noticed this kind of thing even with Compustat data, which really is PIT, so it's not just a data issue. Data on Portfolio123 is never completely and absolutely stationary, even if it's PIT and in the past. One extremely tiny difference in the past (like the one Victor pointed out) will have a "butterfly effect" (so named after the 1952 Ray Bradbury story "A Sound of Thunder," in which a man goes back in time, accidentally steps on a butterfly, and completely alters the future as a result). I suggest that everyone on Portfolio123 be willing to live with the fact that the exact same simulation performed on different dates will give different results. The question is how to minimize the differences. The easiest way to do so is to backtest large portfolios of 100 or more stocks.

4 Likes

The first 20 transaction in 5/22/2020 are exactly the same. This tells me that something was changed/updated after that by Factset, which had a "butterfly effect". But I would not categorize a change from 30.11% to 31.63% annualized return as a "butterfly effect" , quite the opposite because:

  • It's a very high return
  • There are only 20 positions

This IMHO, is an insignificant change. Just one possible backtest from many of a systematic strategy.

4 Likes

Thanks a lot for all your answers — I appreciate the help, @Victor1991 @yuvaltaylor @marco

Okay, I accept that some changes in backtest results are normal, and we can work with that. But maybe you can help me with a more specific problem:


What can we do when a single factor gives very different results, even for the same past time period?

Like most of you, before I add a factor to a ranking system, I test it on its own. But I got caught in a trap — one day the factor looked great, and the next day, the results were dramatically worse.


To show this, I ran a 3-day test using a 1-factor ranking system.
The factor used: pr52w%chgind

Here are the results from 3 separate days:

As you can see, the results are very different, even though the test period is the same.


Now I have backtest paranoia :sweat_smile:
When I test a factor (and I test hundreds!), I’m always afraid that tomorrow it will turn into a caterpillar instead of a butterfly. :bug::butterfly:


Any tips on how you deal with this?
How do you test factors for true reliability and avoid false positives?

Thanks again!

2 Likes

I always have assumed that the continuous dividend adjustment of the time series of a stock prices at P123 always plays a small role if your strategy uses price based factors. For example, this makes it very difficult to use technical factors (like moving avg crossovers) at P123.

1 Like

@marco:
Main takeaway for addressing similar concerns in the future:
P123 could resolve the issue Babeshkin is highlighting by introducing a very small amount of randomness—optionally controlled by a user-defined seed—to let members decide whether tie-breaking remains consistent across runs. The injected randomness would need to be small enough not to interfere with meaningful rank differences. To support this, P123 may also need to increase internal precision, ensuring the randomness remains smaller than any true differences in ranking.

This wouldn’t be the only use case for a seeded random() function. It could serve as a cleaner, more flexible alternative to the current use of Mod() for generating randomized stock subsets. More broadly, users often want either to introduce randomness or to ensure determinism—depending on the context. I don’t believe it would be difficult to give them that flexibility.

@Babeshkin:
Wouldn’t this factor introduce a significant amount of randomness due to frequent ties within industries? Each time the model is run, the selected stocks could vary considerably due to random selection among equally ranked names.

To better assess consistency—or to identify any potential inconsistencies in the FactSet data—it might be more effective to test with a factor that results in fewer ties.

A quick look at the current holdings of the first two models seems to confirm the large variation in stock selection (presumably due to ties within industries):

Model 1:

Model 2:

CLMB is the only stock held by both models—in this particular run, which likely included some randomness in the tie breaking! Randomness that will be different the next time this is run

The ranking system is purely based on a single industry factor. Therefore, every stock gets the same rank. You will get the same result for re-runs in the same day, but since we reload the servers every day, the order can change for ties.

Your very first transactions are 4 semiconductor stocks. These two strategies both buy semi stocks, but completely different bc they have the same rank.

3 Likes

It would be a trivial programming task to allow consistent tie-breaking when desired, or to give users control over randomness when randomness is desired—such as when selecting a universe (e.g., the current use of Mod() for randomized subsets).

A random() function that accepts a random_state parameter could address both use cases cleanly. The underlying implementation shouldn’t be complex—especially considering how common this feature is in other open-source libraries.

So it would look like this random(seed = 123), or random() with a default like seed = 123 or seed = None--whichever is most clear to members.

This pattern is widely adopted—random_state is a standard argument in nearly every scikit-learn module, including RandomForestRegressor.

There’s clearly strong demand for this level of reproducibility and control across a wide range of use cases, and it would be a lightweight but high-leverage improvement for P123.

1 Like

Oh wow — I went back and checked the other inconsistent factors I’d been watching, and it turns out it was the same reason across the board, same ranking. No idea how I missed it earlier. I was trying to find some deep explanation in the data… and in the end, it was much simpler than I thought.

The good news is — I finally get how to check a factor for consistency without having to test it every single day. Just look at the ranking! :innocent:

You guys are the best — thanks so much for your help!

3 Likes

Just curious, why does reloading the servers cause a randomization of the symbol orders? One would think they would be in alphabetical order.. If not, is it an easy task to alphabetize them for consistency sake?

1 Like

This was initially believed—at least in part—to be caused by the data not being point-in-time, which sometimes gave a false impression of unreliability. I can’t help but wonder how many times we’ve debated whether the issue was due to data quality or just a butterfly effect—when in reality, deterministic tie-breaking (or even just the option for it) would have led us to say:

“Damn, that FactSet data is good.” And in many cases, we might not have questioned the data at all.

In machine learning, this exact issue is commonly handled with jittering—the practice of adding small random values to break ties, either deterministically or not. There’s nothing novel about this—jittering is a standard solution to a well-known problem.

Alphabetical tie-breaking would be fine by me—having AAPL show up more often certainly wouldn’t hurt my sims' performance.

Stock ID is another possibility, though it comes with a caveat: in past tests, it’s actually worked as a performance factor, likely due to correlations with company age. Depending on how it’s implemented, it could bias toward older or newer firms.

And, for example, purposeful randomization is called "dithering," in the field of signal processing. But I think it is to be avoided here, in pursuit of the higher goal of repeatability, as this is a cornerstone of science ( Francis Bacon, 1620, and others.)

Thank you for your response. I completely agree—the option for repeatability is essential. In fact, I think we are strongly aligned on this point. Let me briefly add some context to clarify why I brought up purposeful randomization (a.k.a. dithering) and how it fits into this shared goal.

  1. P123’s current implementation is not repeatable. That’s precisely why this thread was started. As previously noted, some features like pr52w%chgind can produce extreme inconsistencies. Of course, when using many factors in a ranking system, the results can still be fairly stable. I’m not trying to overstate the problem—but reproducibility is clearly limited in its current form.
  2. Purposeful randomization can be made repeatable—and is, in fact, a standard approach in libraries like scikit-learn, which use random_state or similar parameters to ensure deterministic behavior. My interest is in adding something similar to P123’s Random() function—a seed or random_state argument—so users can choose reproducibility when needed. I believe this complements your point entirely.
  3. Alphabetical sorting as is a solid idea, and could certainly provide one form of consistent tie-breaking. I’d support adding that as an option for reproducibility as well.
  4. That said, even if alphabetical sorting is implemented, the ability to set a random_seed would still be useful in other contexts. For example, it could replace mod() when defining subsets of a universe—offering more flexibility and consistency in experimentation.

Lastly, when running something like an elastic net regression, I’d much prefer working with dithered or jittered data (which avoids repeated identical ranks) rather than sharply discontinuous inputs. For example, compare these two:

Dithered/jittered:

Than this (no tittered or jittered):

I can’t imagine the superiority of the dithered data for regression modeling not being immediately obvious after seeing this.

I won’t go into implementation details here, but suffice it to say the issue goes well beyond tie-breaking. It involves how NAs are handled, fixed bucket sizing, and other factors that can subtly—but meaningfully—impact modeling outcomes. Ultimately, this influences how well your machine learning model trains. While the drawbacks of undithered data are clearly visible in elastic-net regressions, I’d argue it’s suboptimal for tree-based models as well.

BTW, scikit-learn institutes dithering that uses a random_state option to make it reproducible. So jitter can be reproducible when desired for sure: Lars

Jrinne,

I agree with with your assertion that dithering can be useful, as an option, and the key word is option, in many contexts. It is not desirable as a built in feature, because repeatability is no longer achievable, and other problems may be masked.

I agree also, as a long time user, that P123 current implementation is not repeatable, due to changes both on the database side, and the algorithmic side. But this does not discount the desirability of aspiring to a repeatable result. I have sims that are highly repeatable, due to minimal use of fundamental features, and consistent data points, and others whose performance changes frequently and radically.

As far as the chart comparing dithered vs non-dithered, I think it may be a bit of an apples vs oranges comparison, and I am reading into it without seeing the details, but I assume the first chart is an ensemble average of multiple dithering results while the second chart is a single run, which may be an "unlucky" result. A single unlucky dithered run could occur as well..

Steve

Actually—no averaging involved at all. Both charts are from single runs of P123's rank performance test that we all know. The only difference is that the first chart uses a single run of simple dithering, and the second is the standard undithered version using a common feature: quarterly earnings estimate revisions.

Here’s what’s happening:

  • In the undithered version, all the NA values are assigned the same rank. This causes them to collapse into a single bucket—and that bucket’s position can shift slightly from week to week. Worse, some neighboring buckets can end up empty. So you get a clustering effect that completely distorts the middle ranks, often making several central buckets show near-zero average returns. The result is a broken return structure.
  • In the dithered version, the NA values are assigned slightly different ranks, dispersing them across the distribution. This avoids bucket collapse and restores a smoother, more continuous return profile. It’s not about getting “lucky”— it’s about eliminating a structural bias.

To be clear:

  • The only difference between the two runs is a second node: Random() added with weight 1 (vs. weight 100 for earnings revision).
  • This is just basic, single-run dithering, not an ensemble average or multi-seed analysis.

If you’re curious, you might also take a look at how P123 currently handles NAs under the “Neutral” setting. Here’s a screenshot illustrating it. This does show how clustering around a single (but changing) rank can occur with NAs, AND how surrounding buckets can get returns of zero. The surrounding buckets showing absolutely zero return is key to creating the distortion.

The full link on how P123 handles NAs is here for your review: P123's handling of NAs

So again—no averaging, no cherry-picking. Just a real-world example showing how a small amount of controlled randomness can prevent serious distortion when dealing with discrete bucket structures and NAs. This example uses quarterly earnings estimate revisions which almost everyone uses, I believe.

Alphabetical seems arbitrary, but what are everyone's thoughts about the same formula but applied within the industry? This is repeatable- a "tie-breaker" setting/dropdown. That and randomization could be two different options. I like randomization myself. Another one could be Market cap, etc. Maybe even just adding a line in the factor description or simulation tool page explaining that it can produce different back-test results to use a lot of stocks with the same rank too.

More deterministic: pr52w%chgind + Frank("Mod(stockid,3)")/100—or better yet, Frank("pr52w%chgind") + Frank("Mod(stockid,3)")/100 to ensure the offset remains small relative to the main feature’s rank.

You’d likely need to apply a similar technique to every feature in your ranking system—especially those prone to frequent ties.

This adds a small, reproducible offset based on StockID to break ties consistently.

It directly addresses the original issue of pr52w%chgind not being reproducible across runs. A similar approach can also support reproducible dithering—though Random() would offer much finer variability if reproducibility weren’t a requirement.

The main limitation of Mod() is that it typically generates only 10 distinct values. More elaborate constructions—such as averaging multiple Mod() expressions—can expand that range, but quickly become unwieldy and is still quite limited. Random() would provide far better resolution, but is currently not reproducible in P123.

@marco: Increasing the precision of the ranking system—e.g., by allowing more decimal places—would let us use something like Frank("Mod(stockid,3)")/1000 instead of dividing by 100. This would ensure that the added offset is small enough not to alter the underlying rank order.

If it’s not too computationally expensive, I think users will increasingly adopt this approach, and higher precision would make it functionally perfect.

And in fact, rounding behavior—with the current level of precision—may account for a small number of the apparent ties we’re seeing.

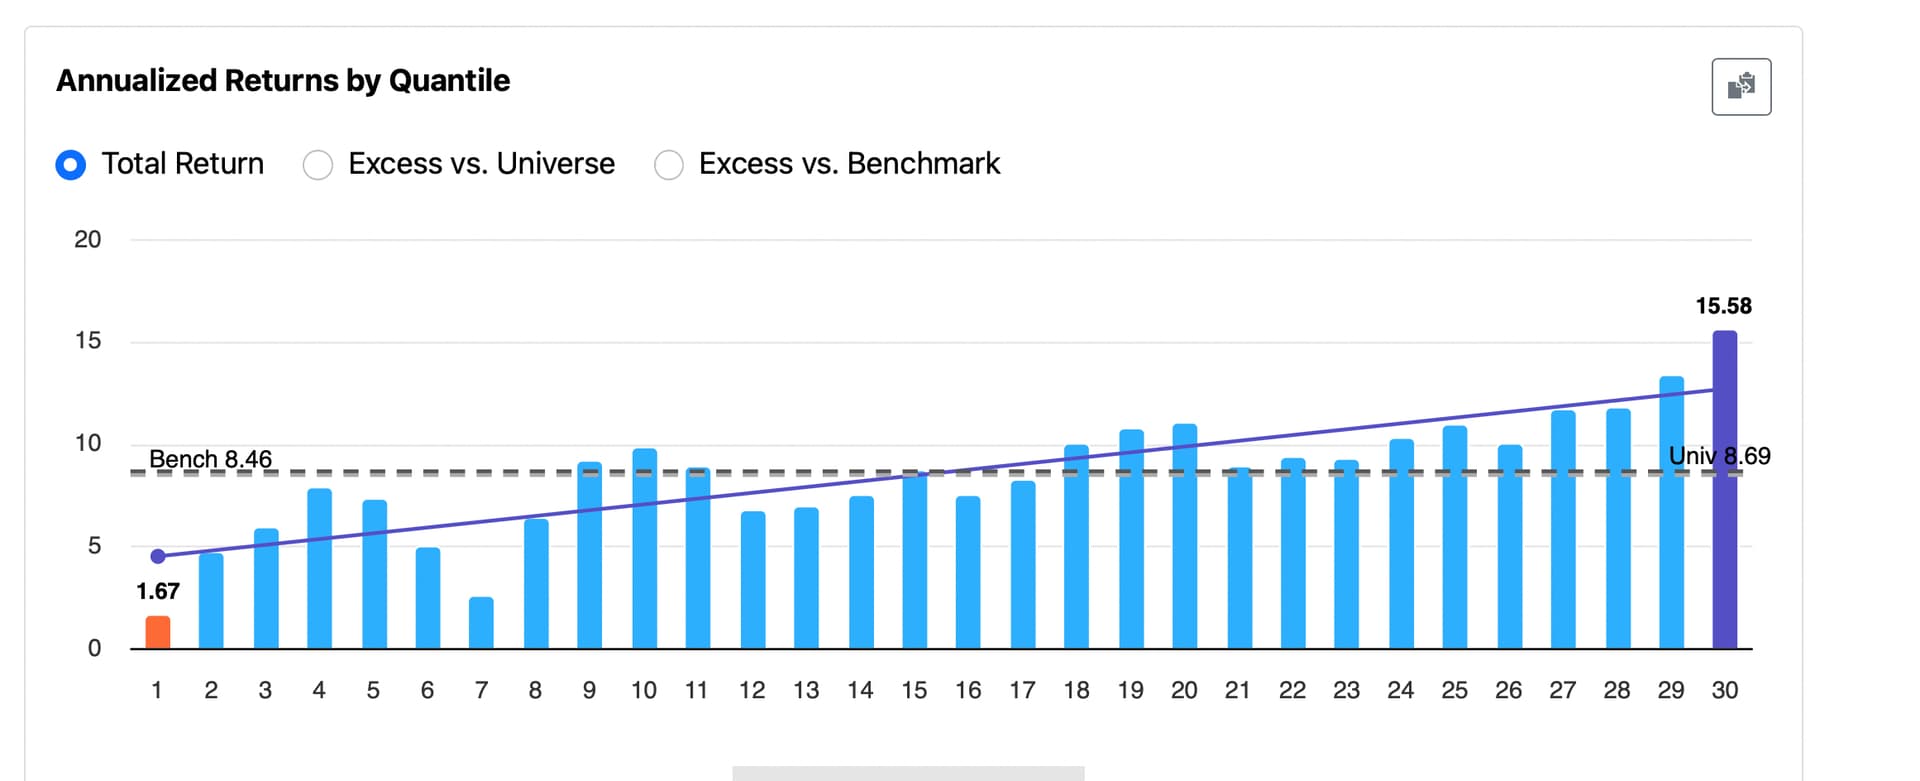
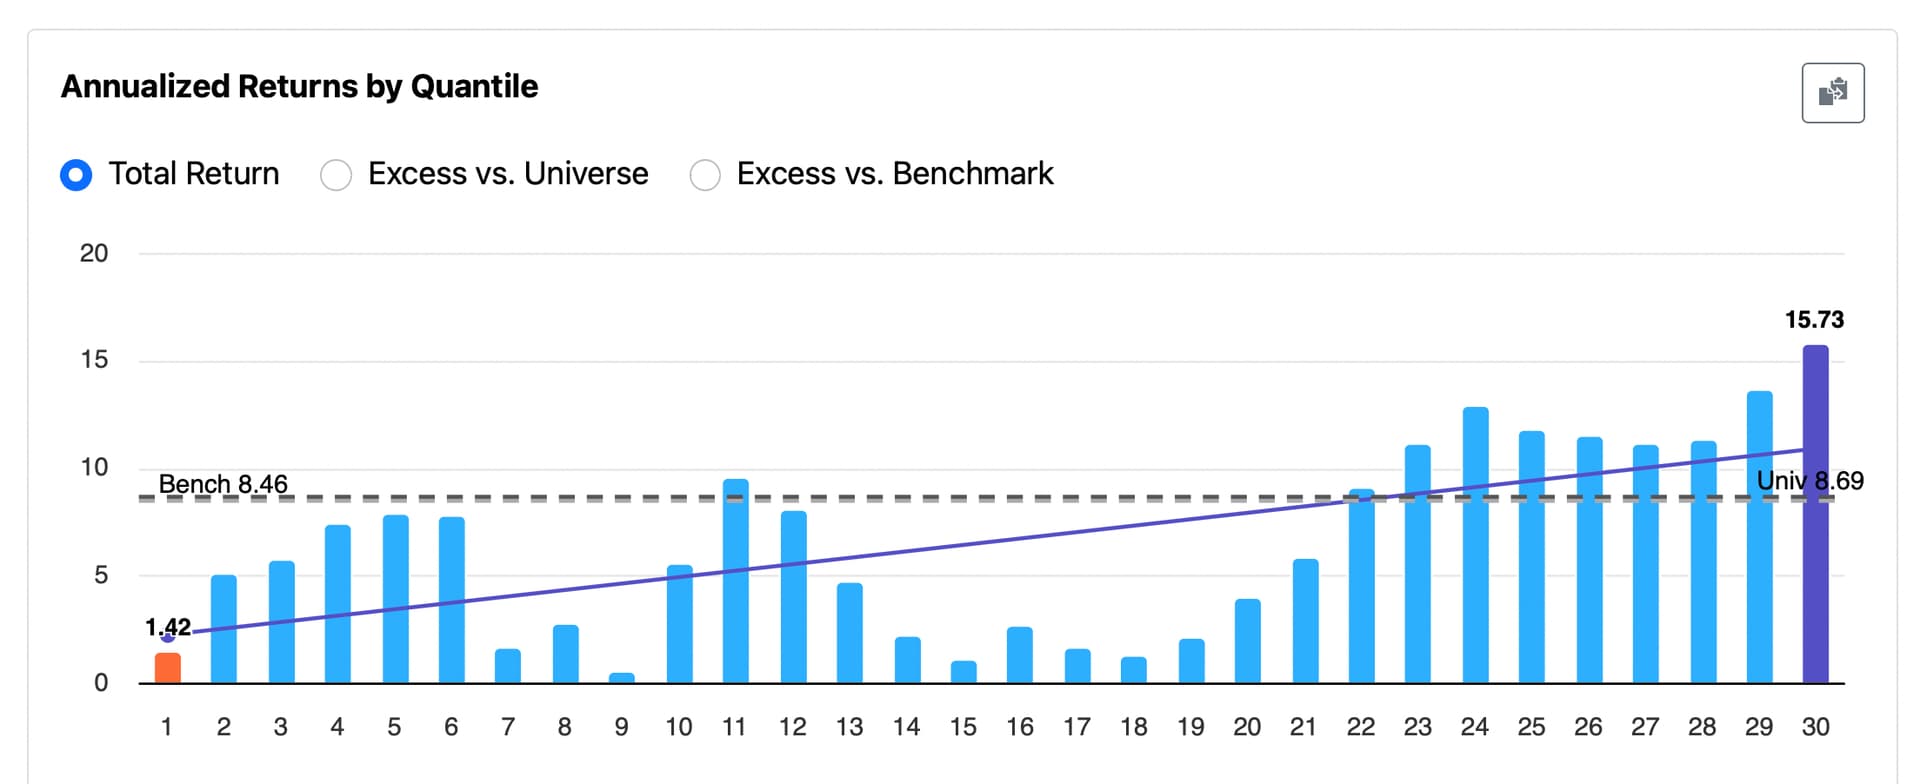
P123 team: Even if this isn’t widely adopted by others, I’d personally like to use dithering to improve the smoothness of rank performance tests and reduce the bias from ranks or buckets that show zero (or artificially low) returns—especially in the middle ranks.

There’s really no informed debate that assigning NAs a single, undithered value is the root cause of the chronic distortion observed in the middle rank buckets of performance tests—when a significant number of NAs are present. There’s also a workable solution—one that could be made functionally perfect with increased precision. I believe the improvement would be noticeable from a marketing standpoint—for both retail and enterprise investors.

Higher precision would give me confidence that I’m not inadvertently altering the true rank order. I’d really appreciate it if you could evaluate whether increasing precision is a significant programming challenge, and whether it would meaningfully impact computational resources.

To be clear, I wouldn’t need any additional changes—just higher precision. I don’t require dithering to be deterministic myself, though that may matter more for other users and other use cases.

The actual dithering I can do myself with the above code: I just need better rank precision.

I think you will find this change breaks ties deterministically"—or does so for almost every tie: https://www.portfolio123.com/port_summary.jsp?portid=1862751

I have not run this on different days (or when the ranking is not cached) to be sure that is 100% deterministic, but most ties were broken deterministically in the ranking system when I checked. There may be a few lucky (or unlucky) Mod() ties still.